Performance -> SQL Trace
Note
You can start tracing any session in
Session Detailview.
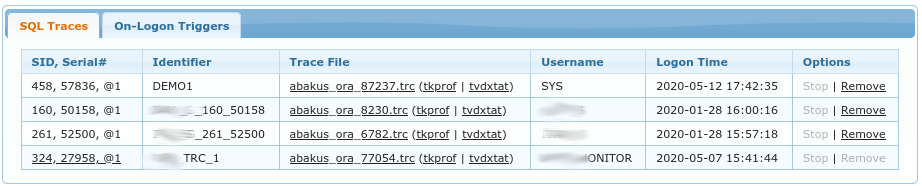
SQL Traces lists all of the trace files created by APPM. It allows you to Stop currently active trace
and to Remove obsolete trace files. Note that you can only Remove those trace files for which session
has already ended (trace file of an active session cannot be deleted through APPM).
You can download raw trace files by clicking on their name such as dbname_ora_<pid>.trc or you can
download aggregated reports based on those trace files. Two such options exists:
tkprof, which is official, Oracle supplied tooltvd$xtat, this is a free tool by Christian Antognini (Trivadis)
On-Logon Triggers
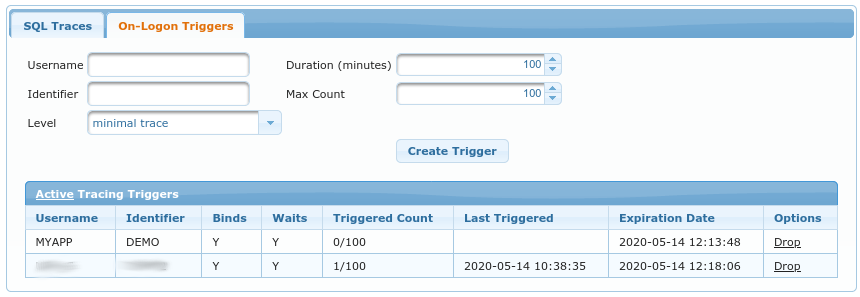
For tracing short-lived sessions or things that happen right after the logon, there is an option to create
ON LOGON TRIGGER which automatically starts the SQL trace. Following options are available when creating
such trigger:
Username- Oracle schema/username which will be traced after logonDuration (minutes)- Drop logon trigger after this many minutes have passed (thus making sure we don’t create such trigger and forget about it)Identifier- tracefile identifier, this is prefix for the trace filename. It is also alias for those traces in this GUI (see previous chapter)Max Count- number of logons to trace, after this many logons the logon trigger is dropped (thus making sure we don’t flood the system with too many trace files)Level- how much detail do we need; it determines whether or not do we need bind variables and wait events present in the trace files.
Table under Active Tracing Triggers displays list of currently active triggers and allows you to immediately
drop the specific trigger if necessary.