SQL Detail
This view can be accessed by clicking on sql_id or plan_hash_value while being on any page under the History menu.
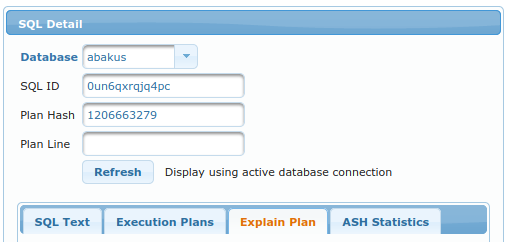
In order to display details for specific SQL, this form displays:
Database- in which database to look for specified sql_idSQL ID- for which sql_id to look forPlan Hash- (optional) display specific plan for this sql_idPlan Line- (optional) highlight specific line in plan table output.
Following tabs are available:
SQL Text
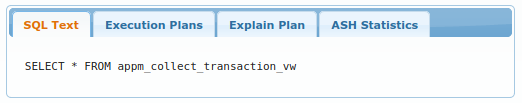
It simply displays SQL Text as seen in v$sql.sql_fulltext.
Execution Plans
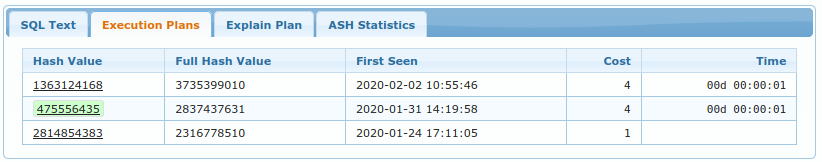
It displays list of all plan_hash_values, which were seen while executing this specific SQL. You can select any of them - currently selected one is colored green like the one on the screenshot.
Explain Plan
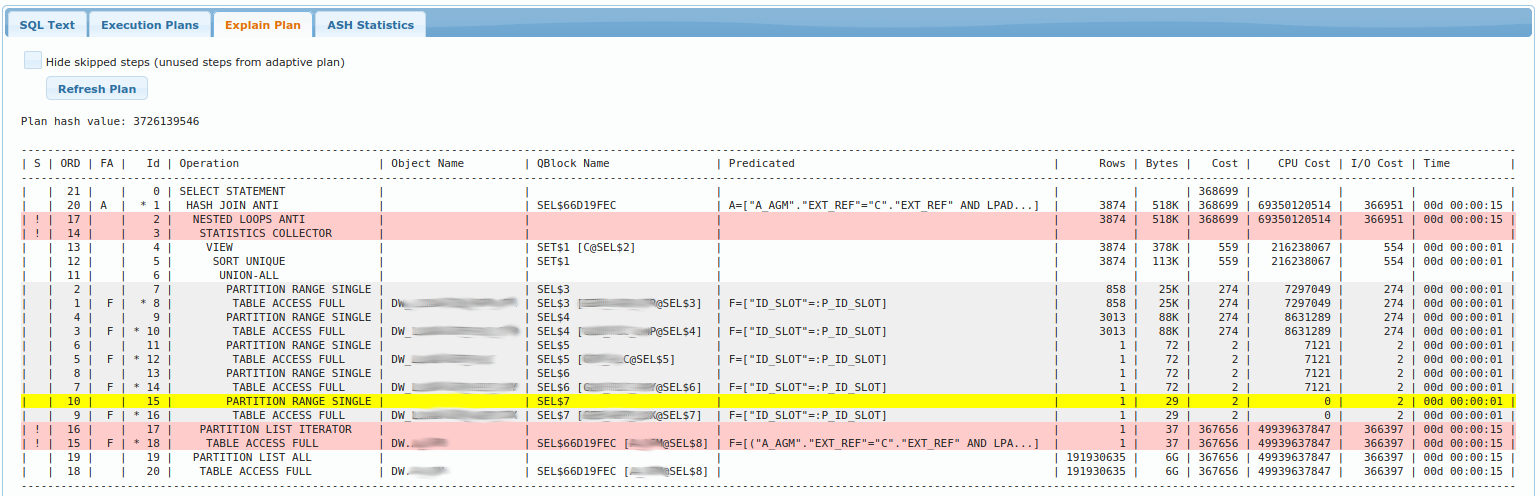
It displays table similar to what dbms_xplan.display() shows;
Yellow line is the line number as specified by Plan Line (to highlight currently executing line of query when
it is known - or it can be used to highlight arbitrary plan line).
Gray lines are those that were already executed (although they can be executed again).
Red lines are steps that were not used due to adaptive plan. You may choose to hide those steps entirely
by selecting Hide skipped steps.
White lines lines are yet to be executed (will be executed after the yellow line).
ASH Statistics
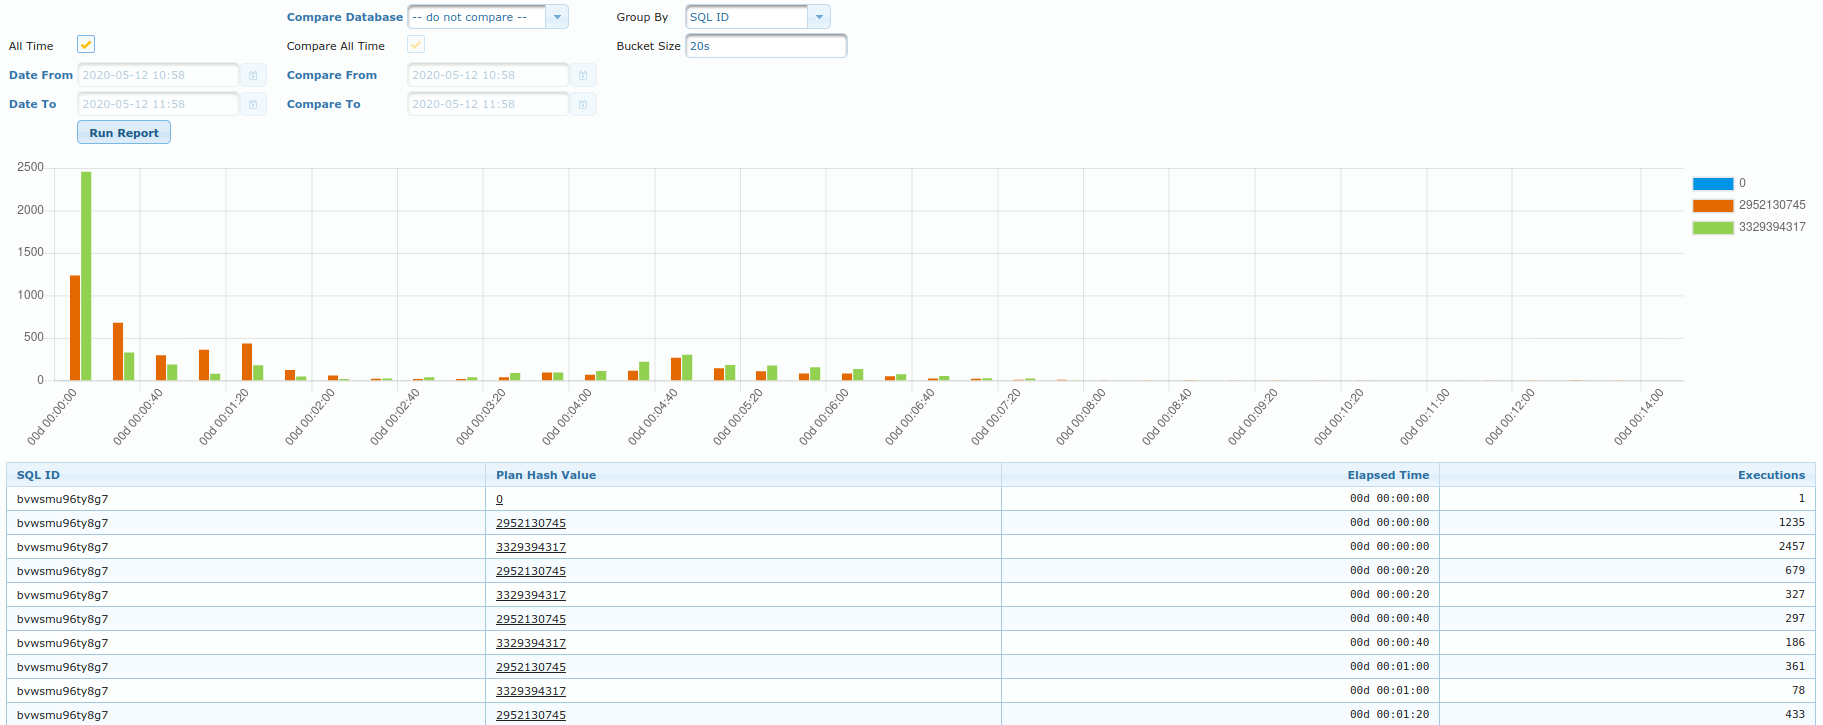
This view should provide insight into which plan (for specific sql) have performed better (faster) than the others. Of course, same plan can perform faster/slower at different times. And so, this view shows histogram of how fast was the plan executed.
e.g. in the chart above, “green” plan was executed 2500 times in under 20 seconds.
Table displays the same data in tabular format.
You can also utility Compare fields in order to compare execution times across different databases or
different periods.