Session Detail
This view displays various info about specific session. Each session is uniquely identified by (fields of this form):
Database- which database it refers toInstance- instance on which the session was logged on (v$session.inst_id)Session- session id (this is unique only at specific point in time for specific instance). It refers tov$session.sid.Logon time- when the session logged on. It refers tov$session.logon_time
Additional parameters to this view are:
From- when the period for report of this view beginsTo- when the period for report of this view endsShow event params- whether or not to display event parameters inProfiletab.
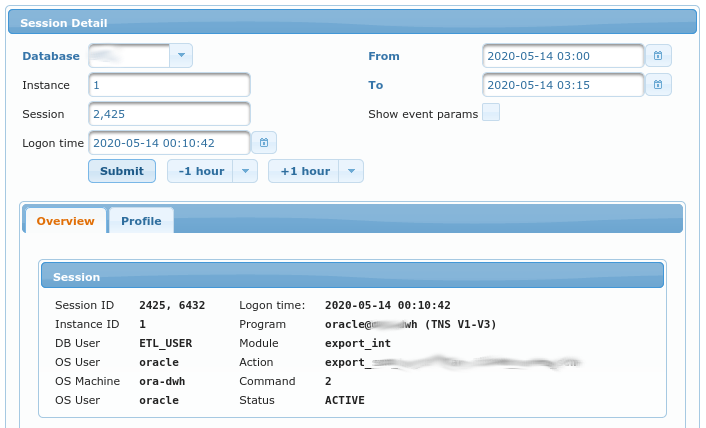
Overview
Session
This view display values from v$session
view. Fields are documented in official Oracle documentation.
Transactions
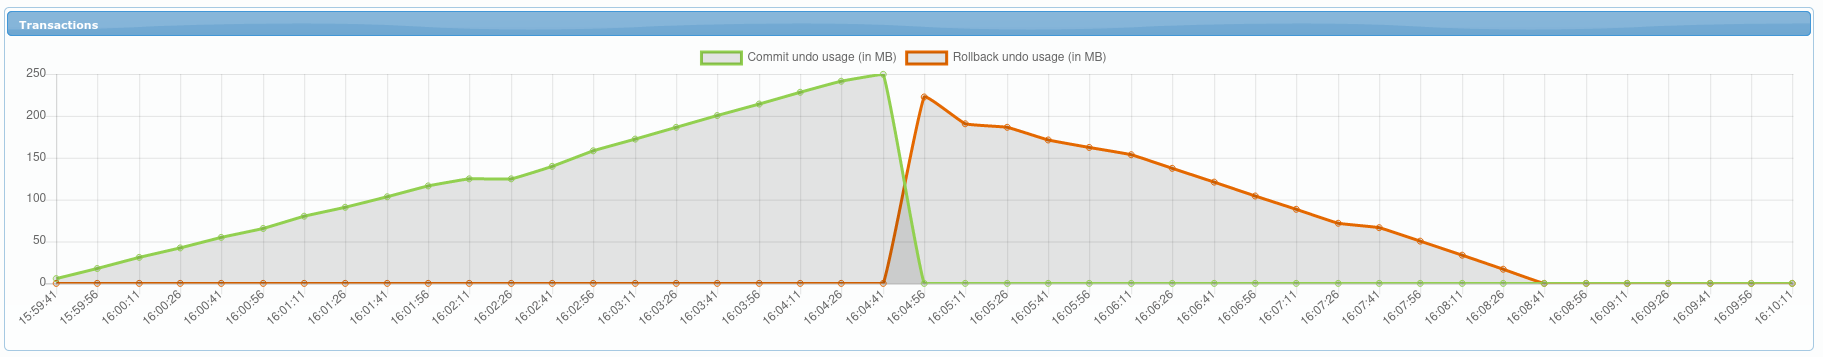
Chart displays amount of UNDO used. Green line shows amount of currently uncommited data. Orange line shows amount of UNDO used by transaction that is being rolled back.
Process
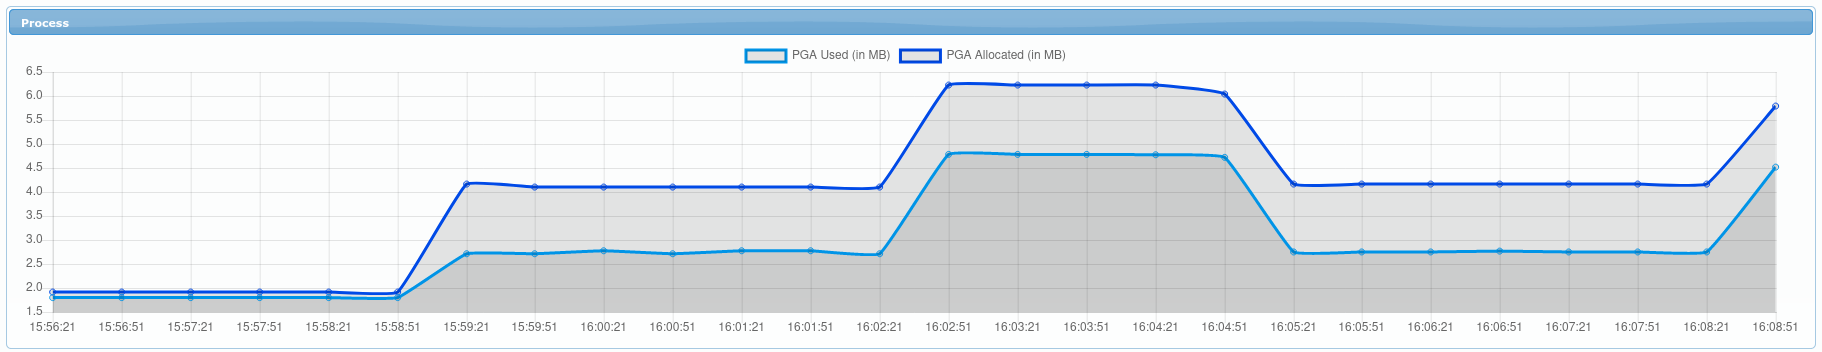
Chart displays PGA memory usage for this session’s process. Darker line shows allocated usage (in MB) and ligher line shows actually used PGA (in MB).
CPU
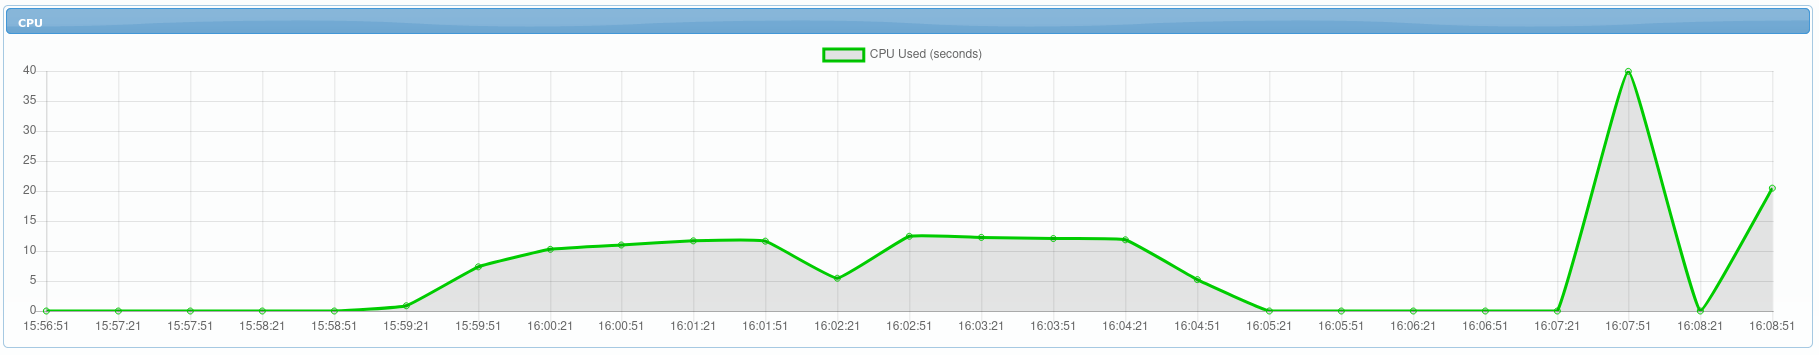
CPU Usage for this sessions’s process. This chart is available only for databases version 18c and higher, where
v$process.cpu_usage is available.
Profile
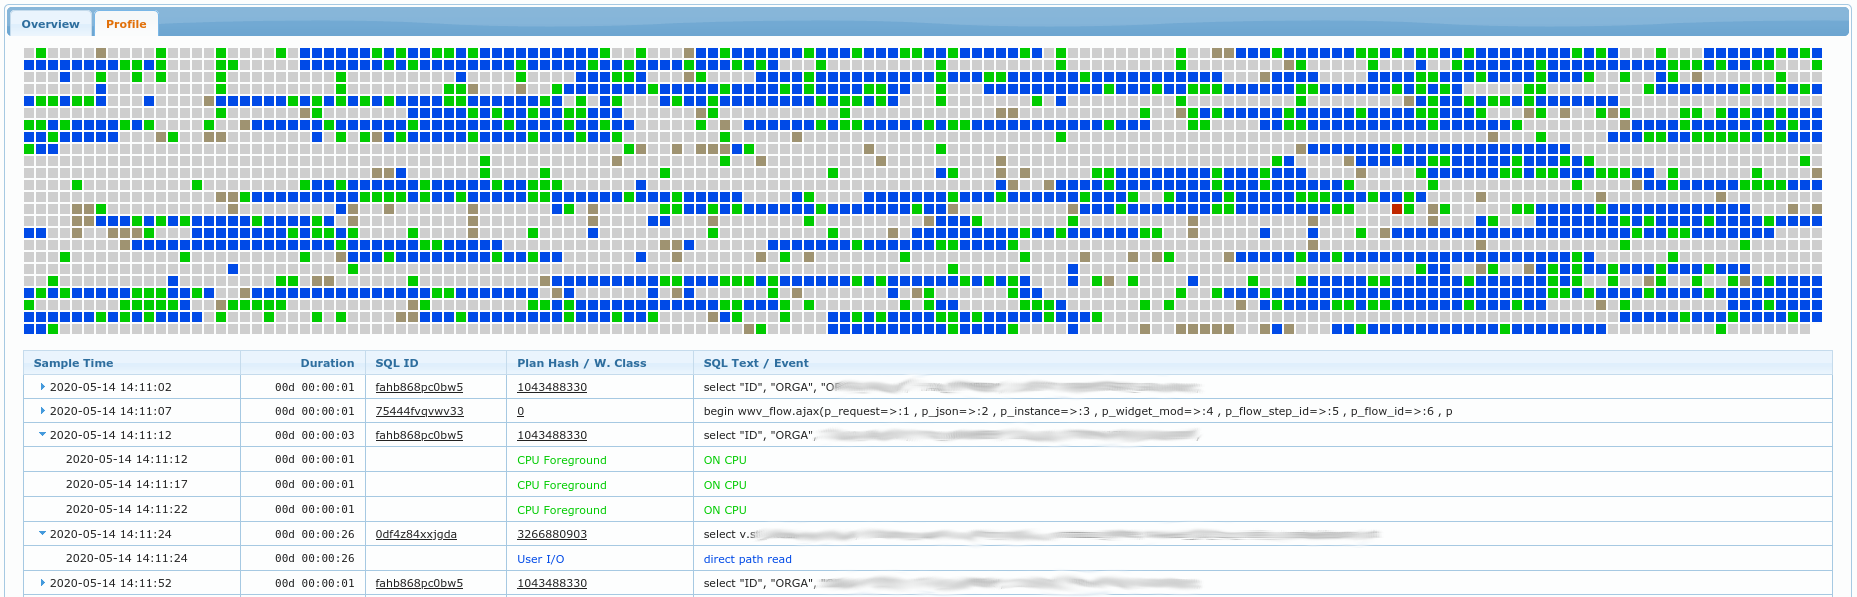
If selected period is <= 2h, then chart with a lot of small squares is drawn. Each sqare represents 1 second of what session was doing. Gray squares represent idle times while all other colors represent on of the “Wait Class” colors. You can hover over any of the squares in order to obtain tooltip information what the session was waintin on on exactly that moment (which wait class and which event exactly).
Bellow the chart is table with contents somewhat similar to what SQL Trace would provide. It shows list of SQLs being executed by the session and list of events that were waited on for each of those SQLs. Color of event matches the color for a wait class.
You can get even more detailed info (added event parameters) in this table if you set checkbox Show event params to true.