Screenshots I
Following screenshots represent data which is available from APPM repository (postgres database). This data is periodically collected and stored into the APPM repository by APPM collector. Thus, all data presented here is available even when the Oracle database is not accessible.
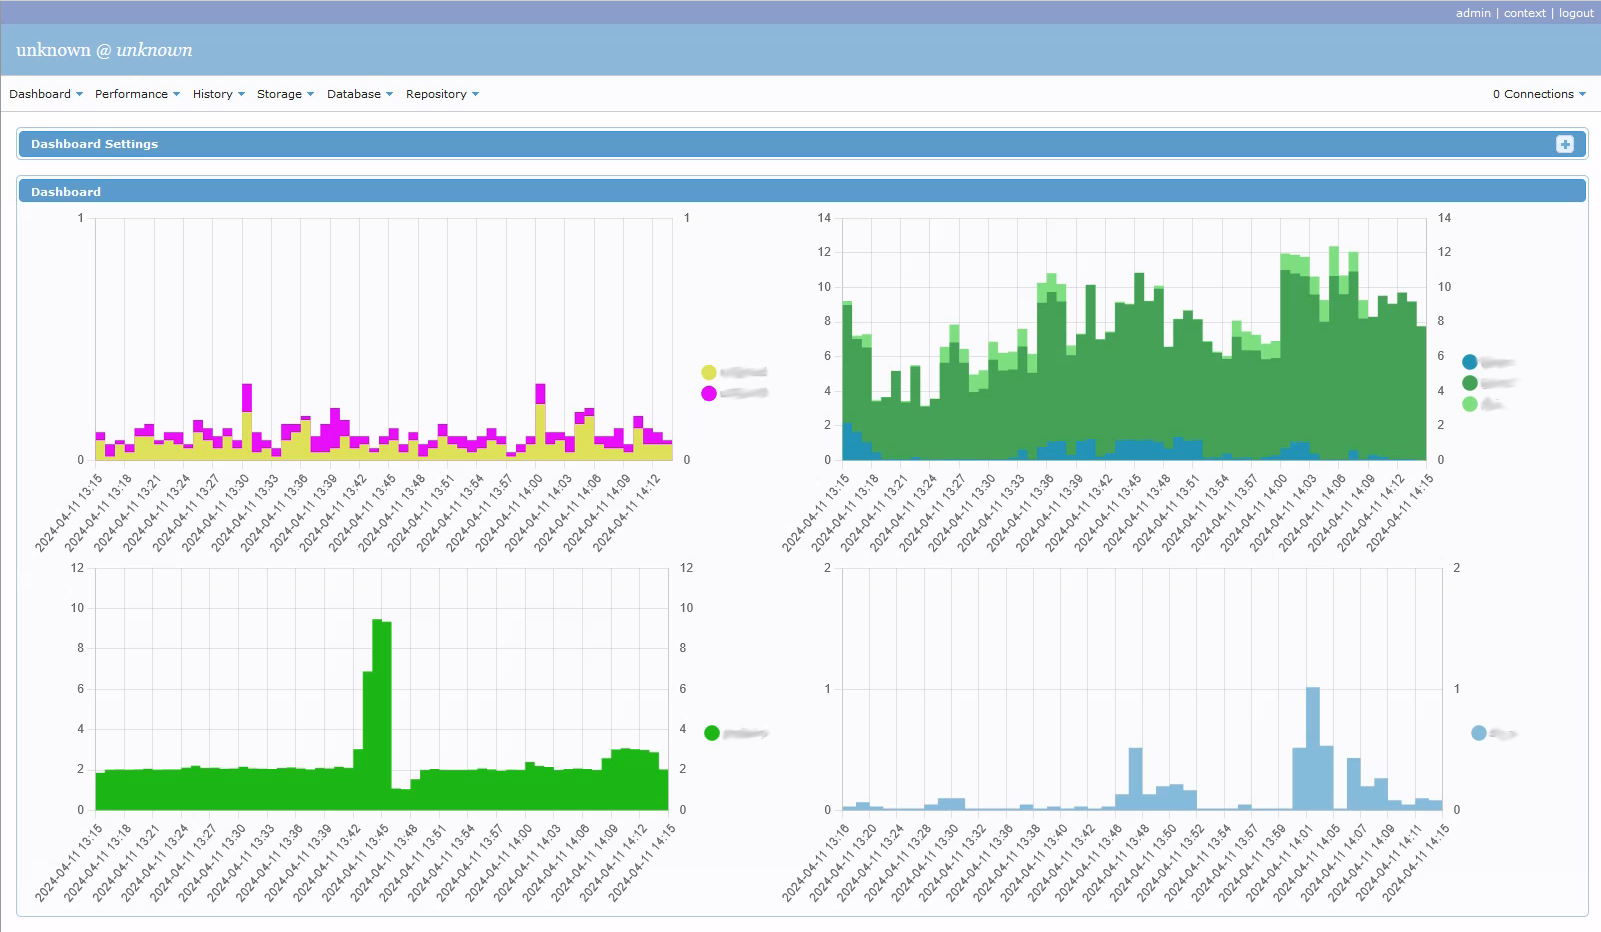 Dashboard
ASH of databases on same host/pdb/cluster
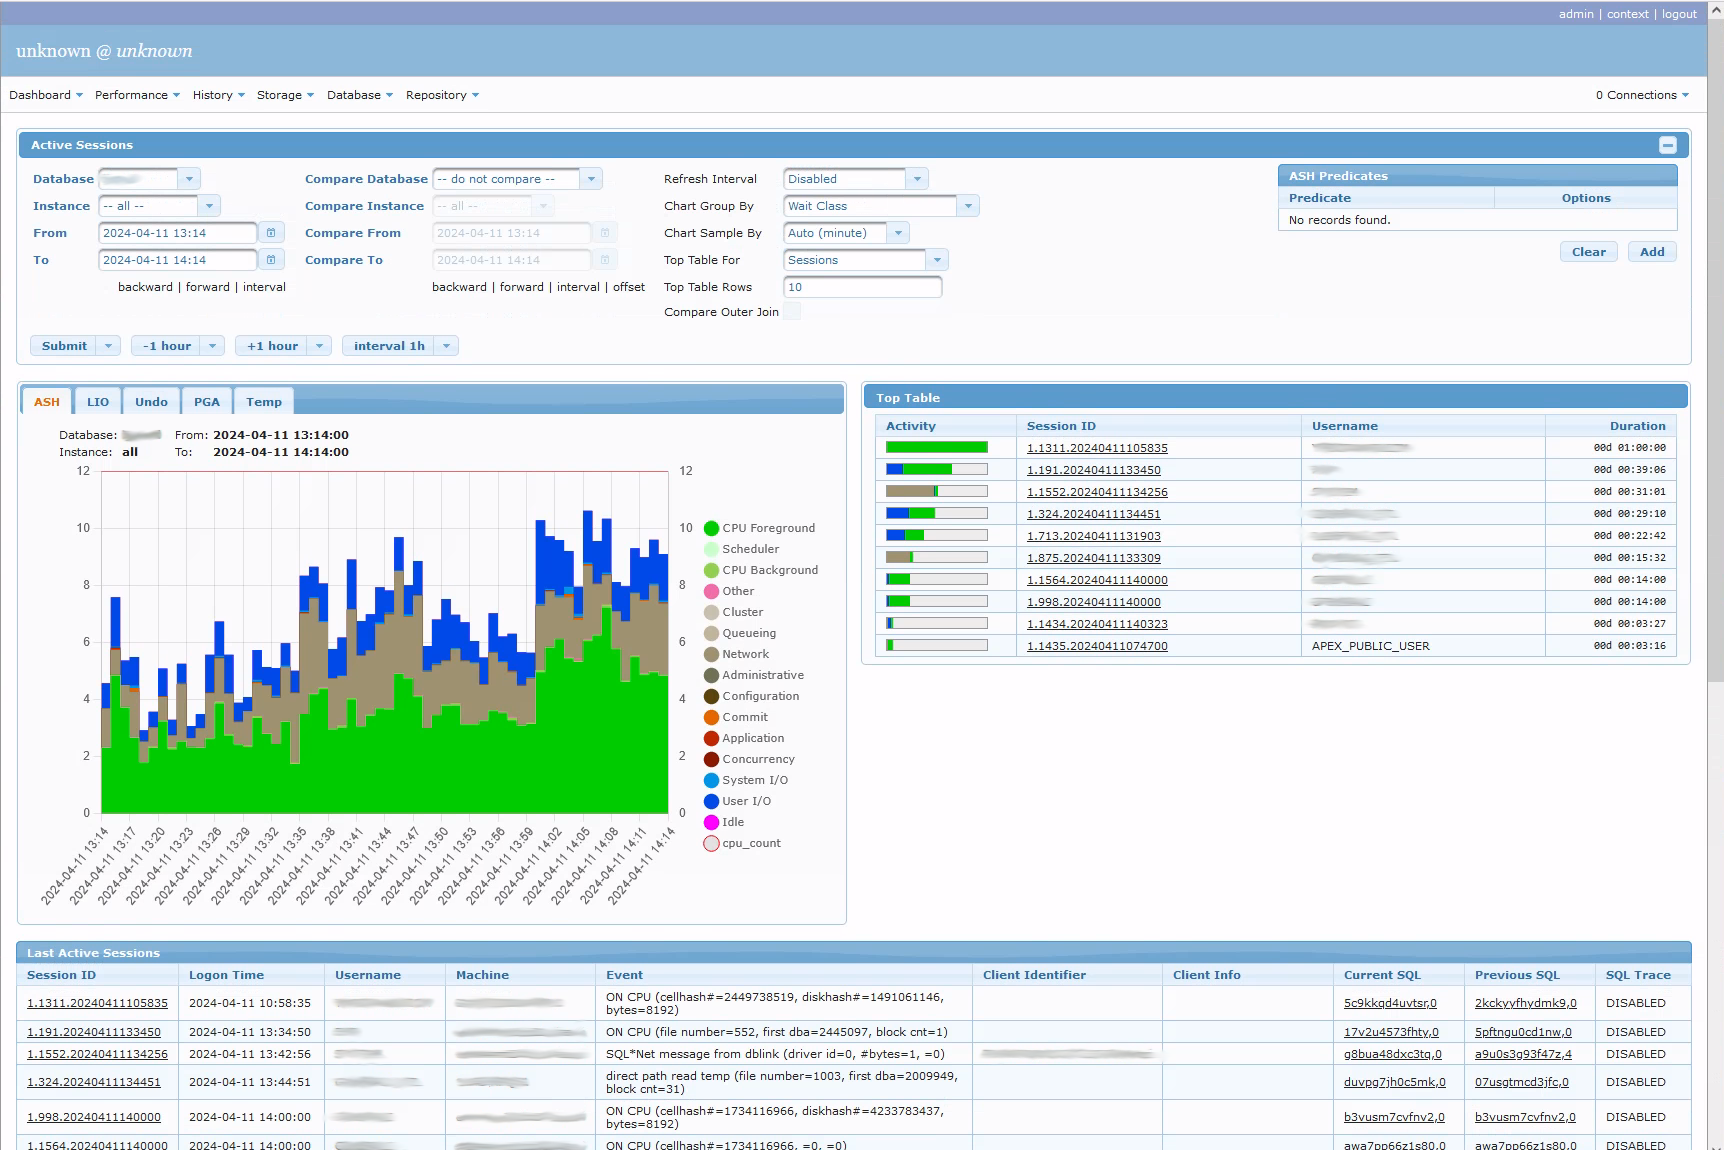 ASH
ASHActive Session History for specific database
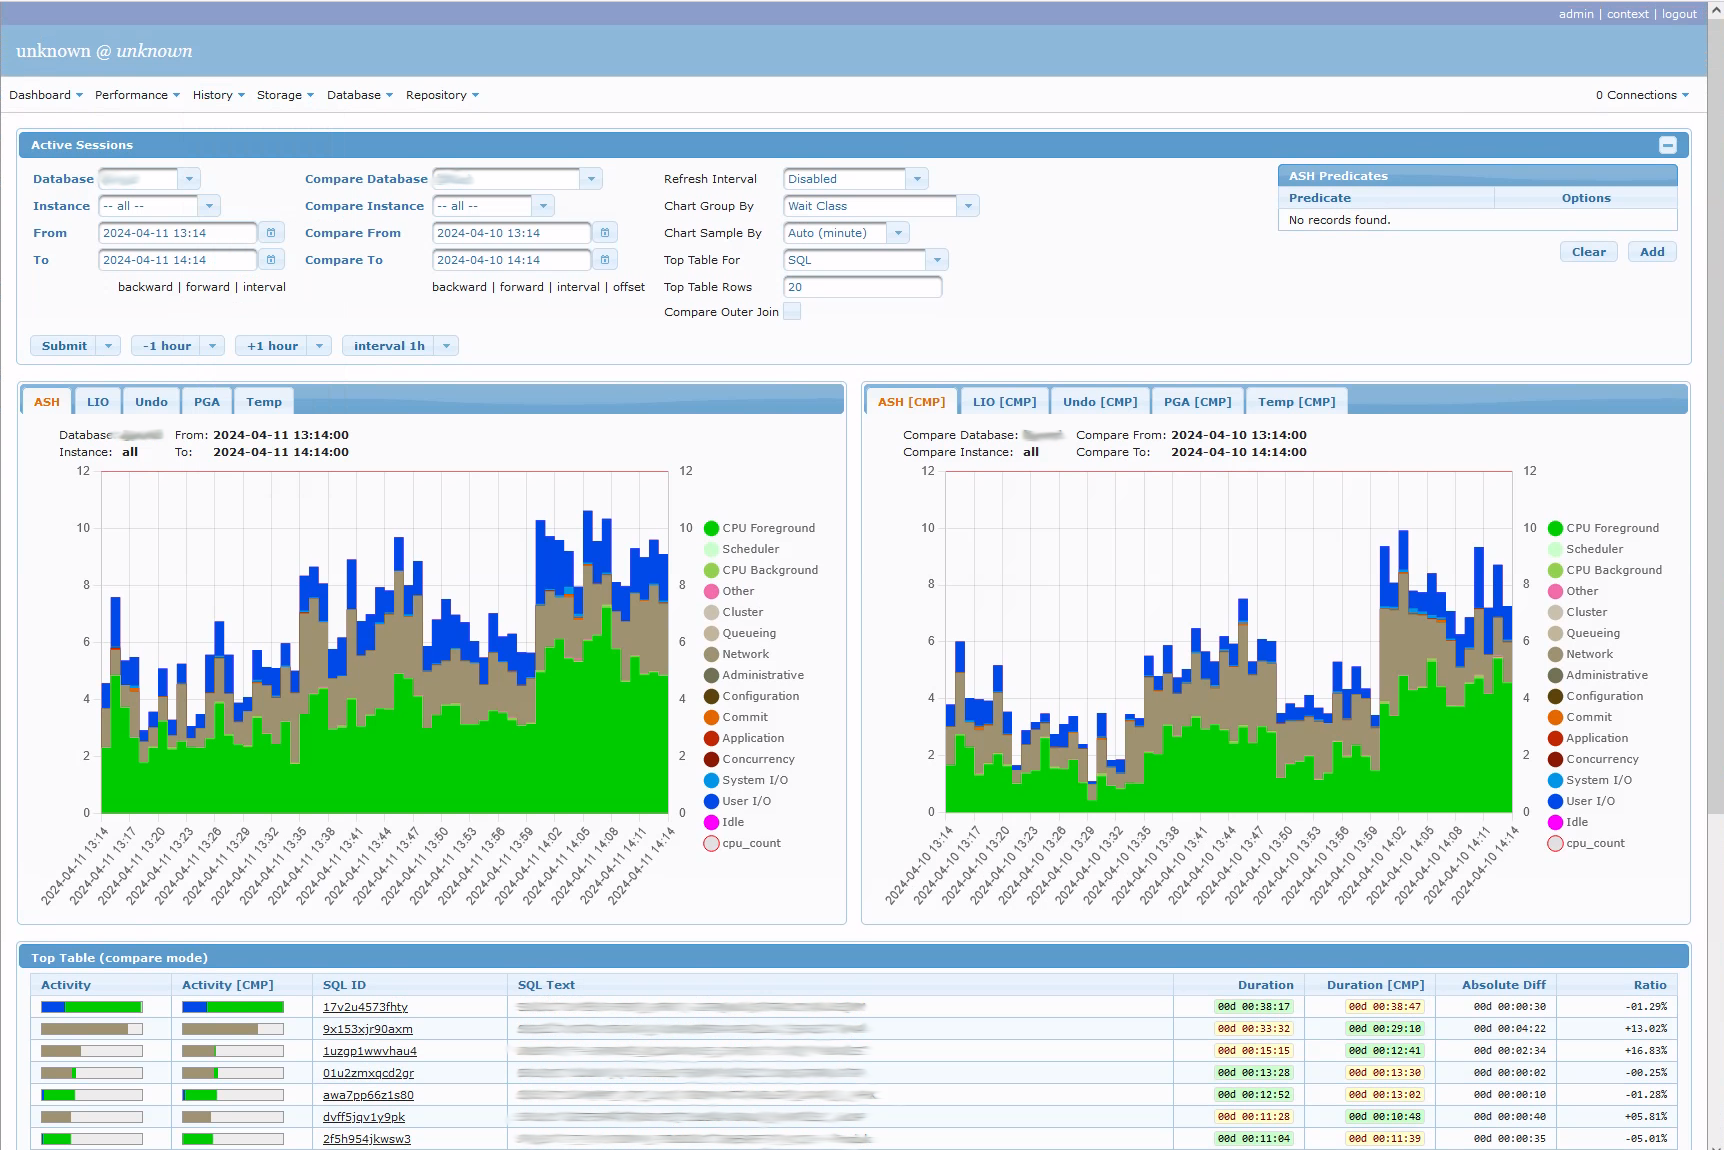 ASH Compare
Compare ASH and sql between different periods and/or databases
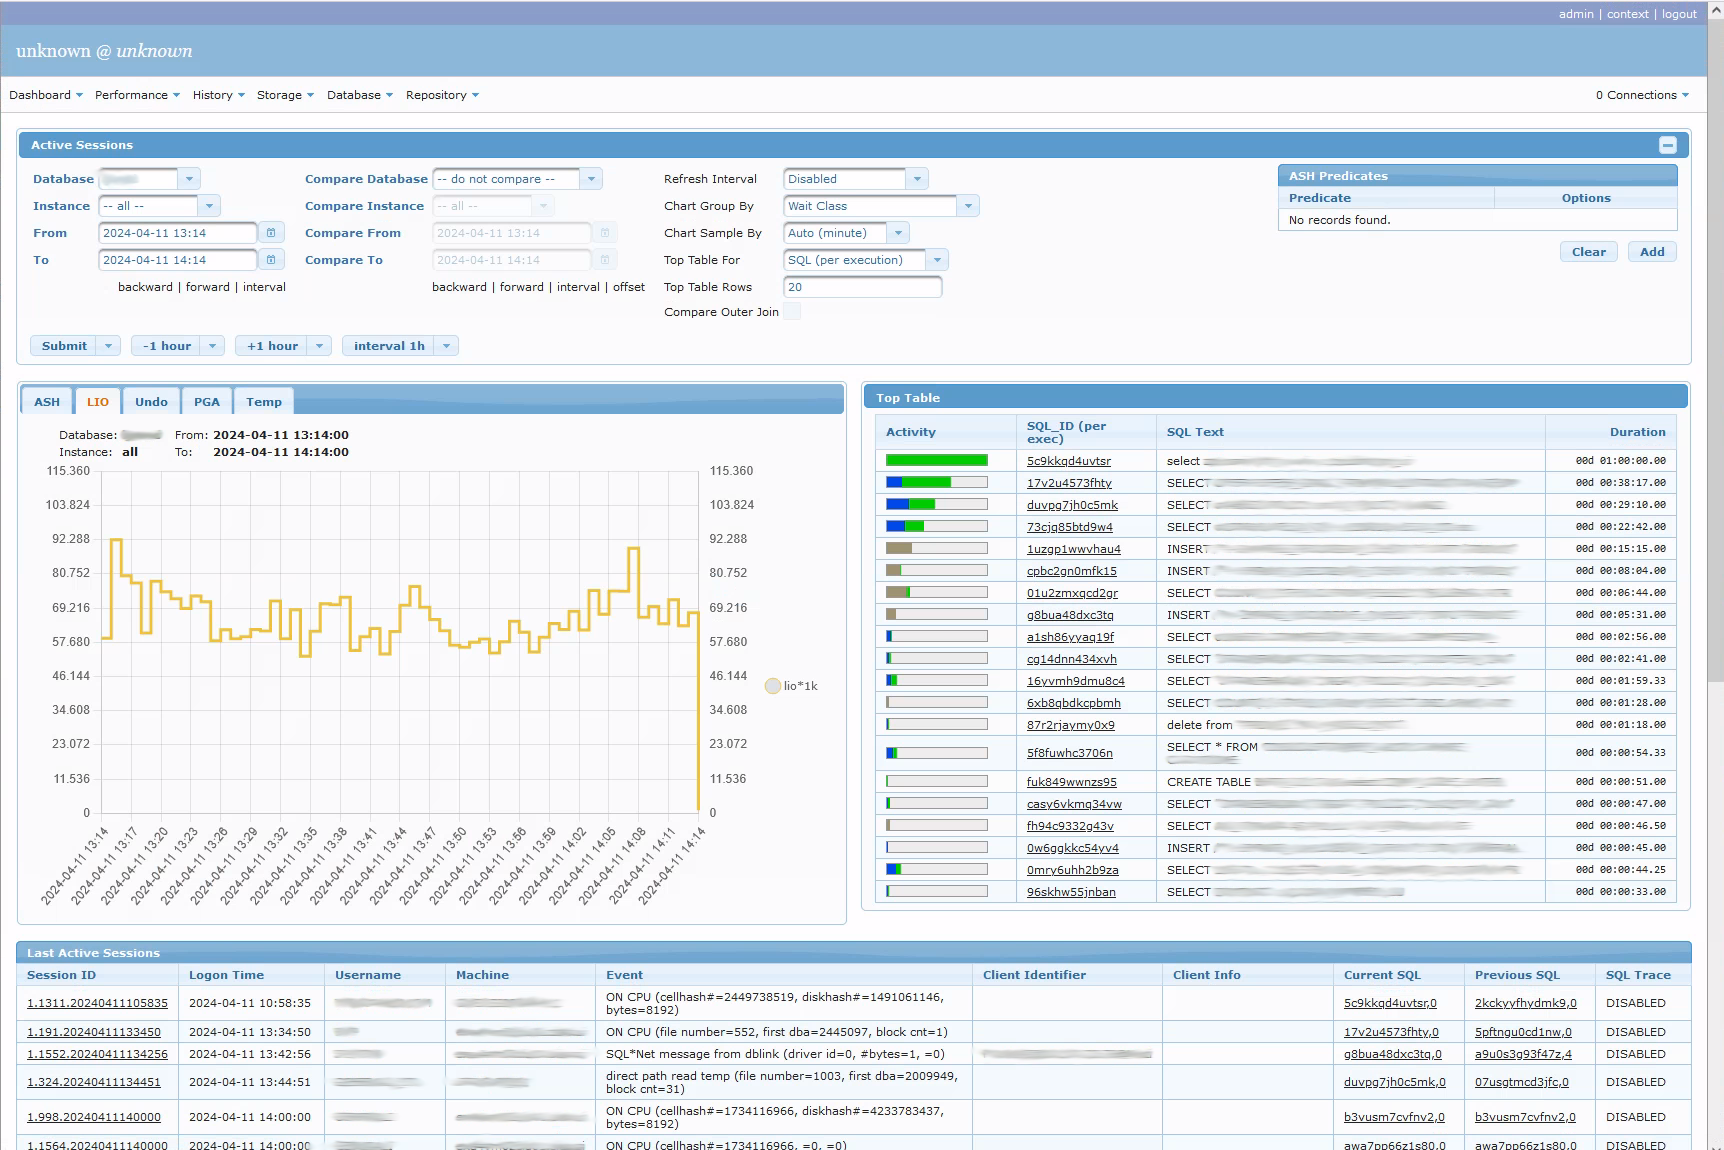 LIO & Top SQL
Amount of LIO per instance and top SQL statements
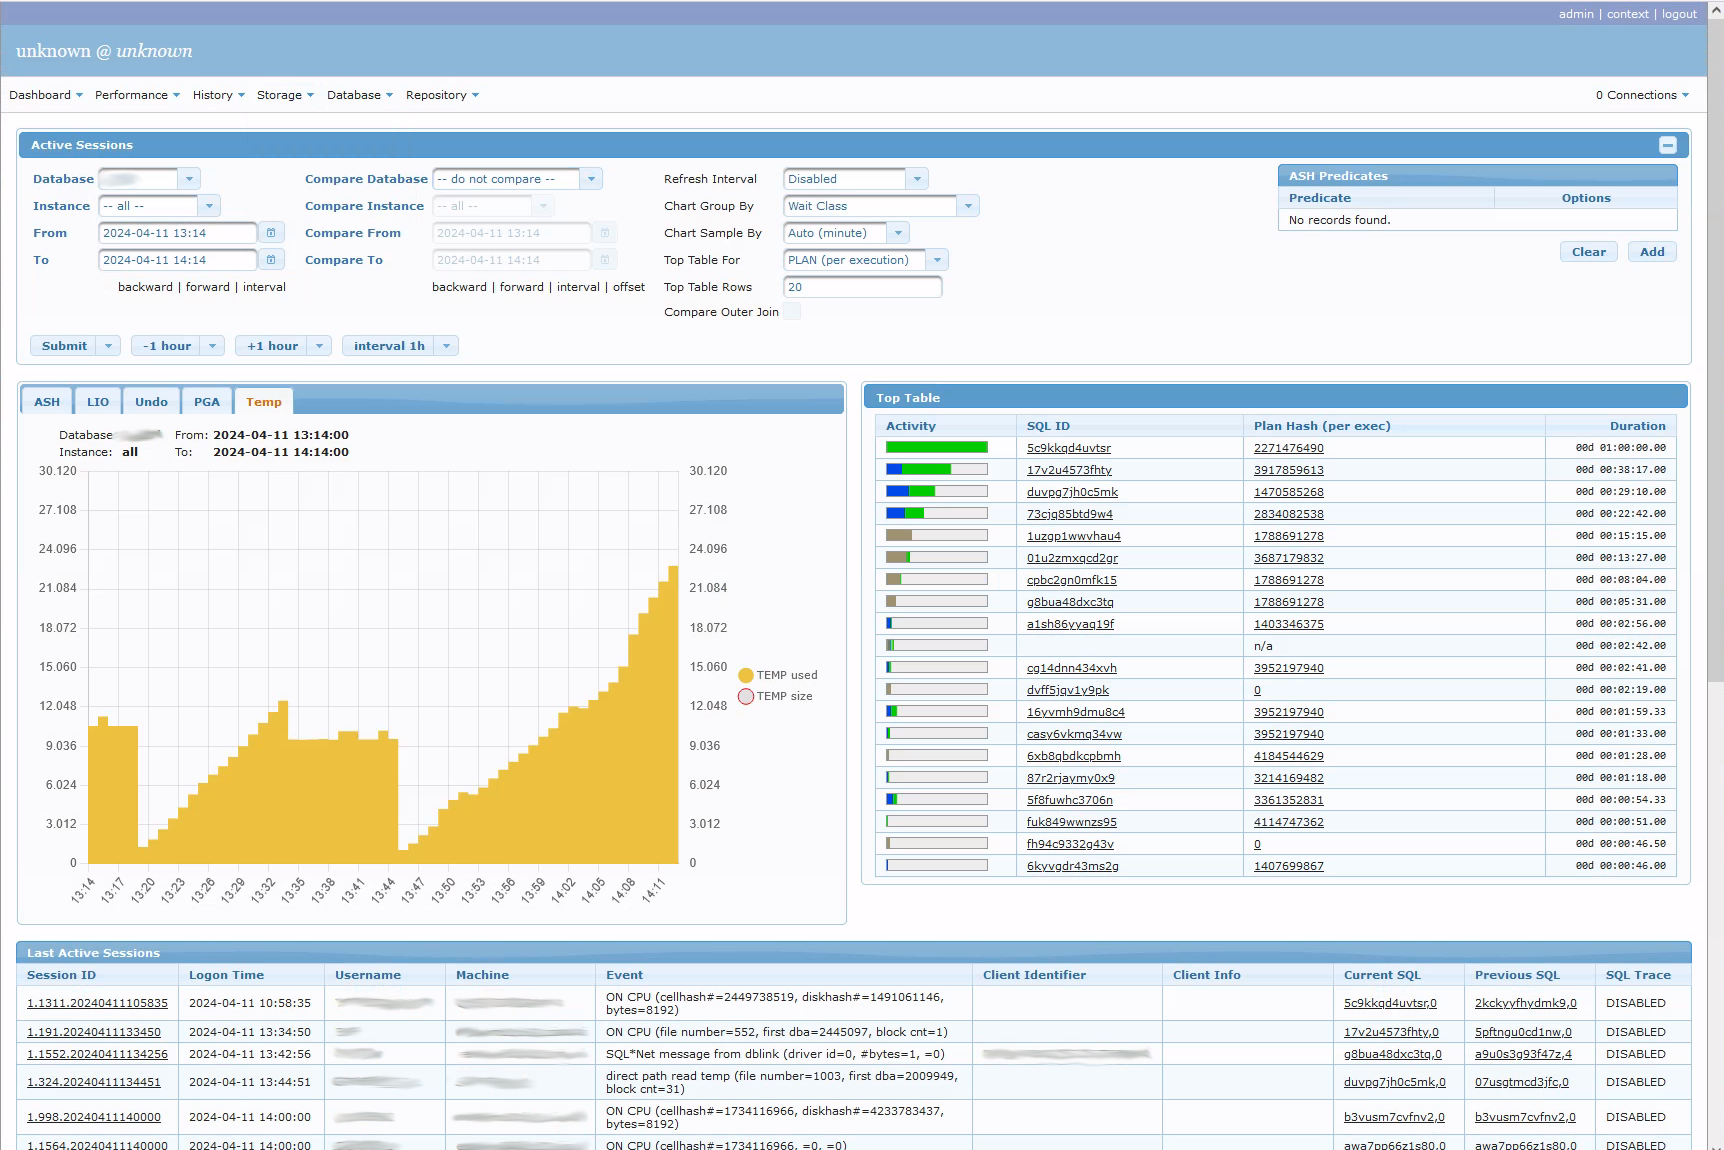 Temp TS & Top Execution Plans
Top 20 execution plans based on ASH.
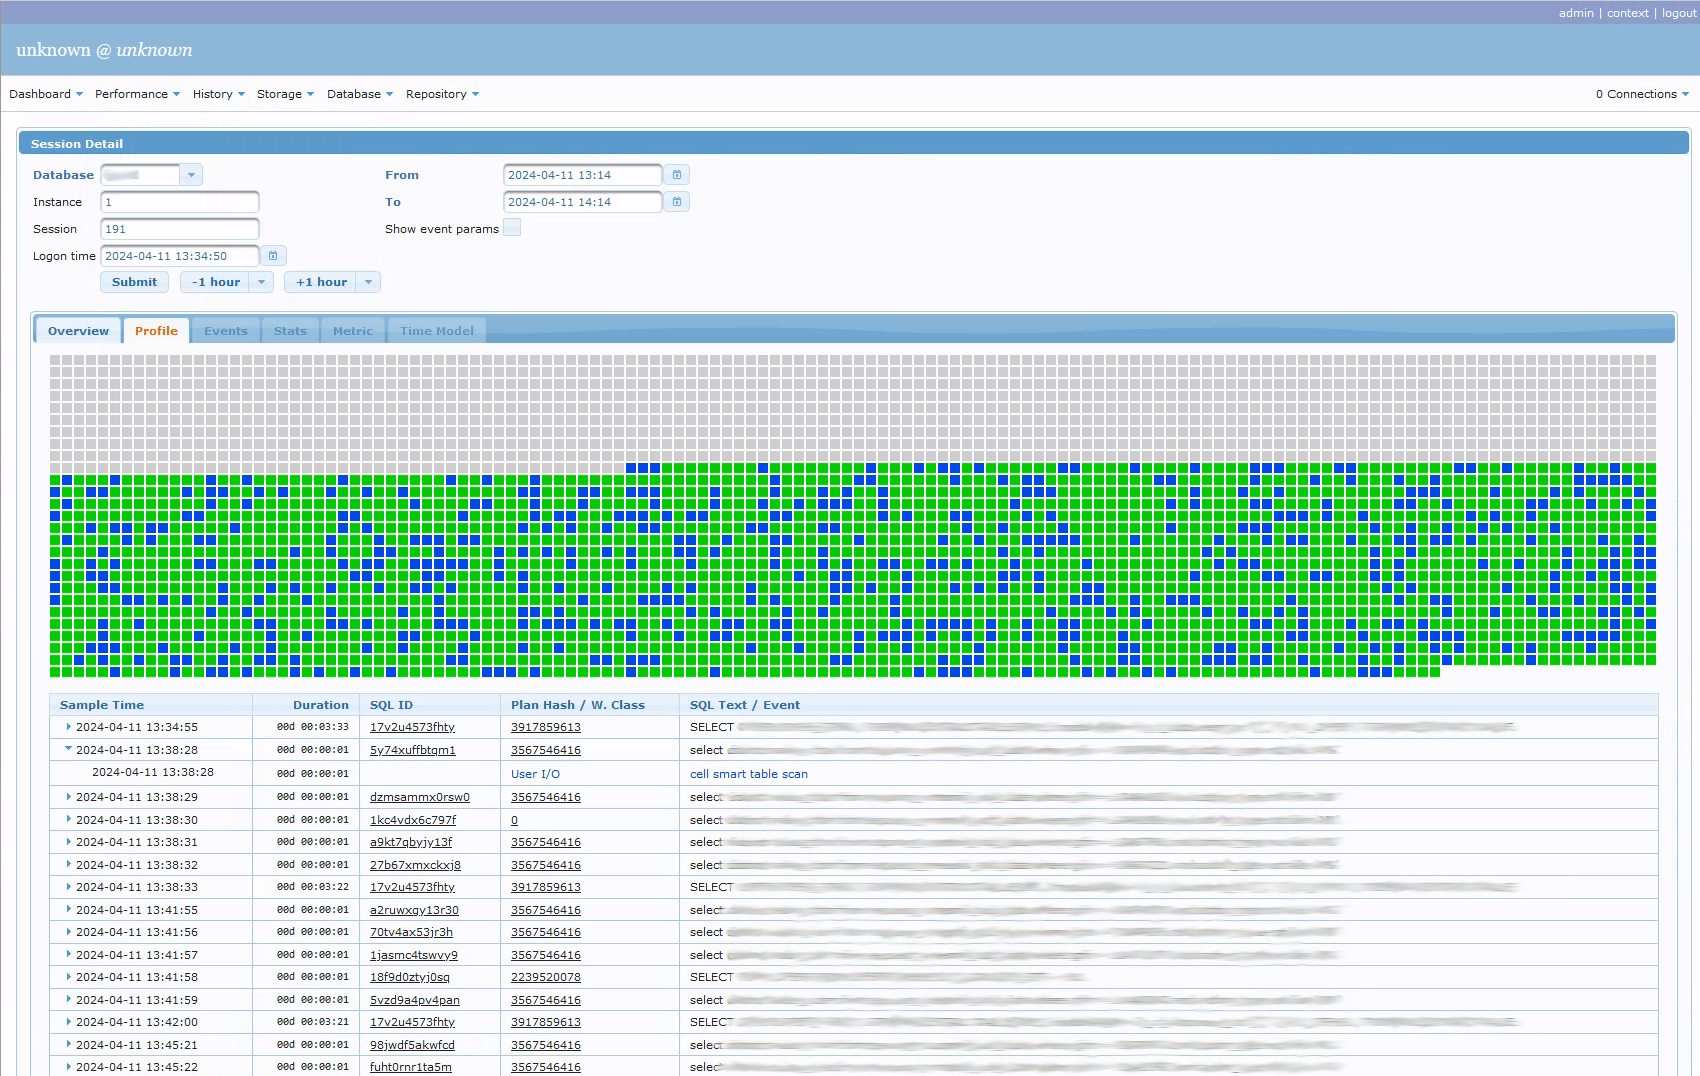 Session Profiling
What session was doing every second
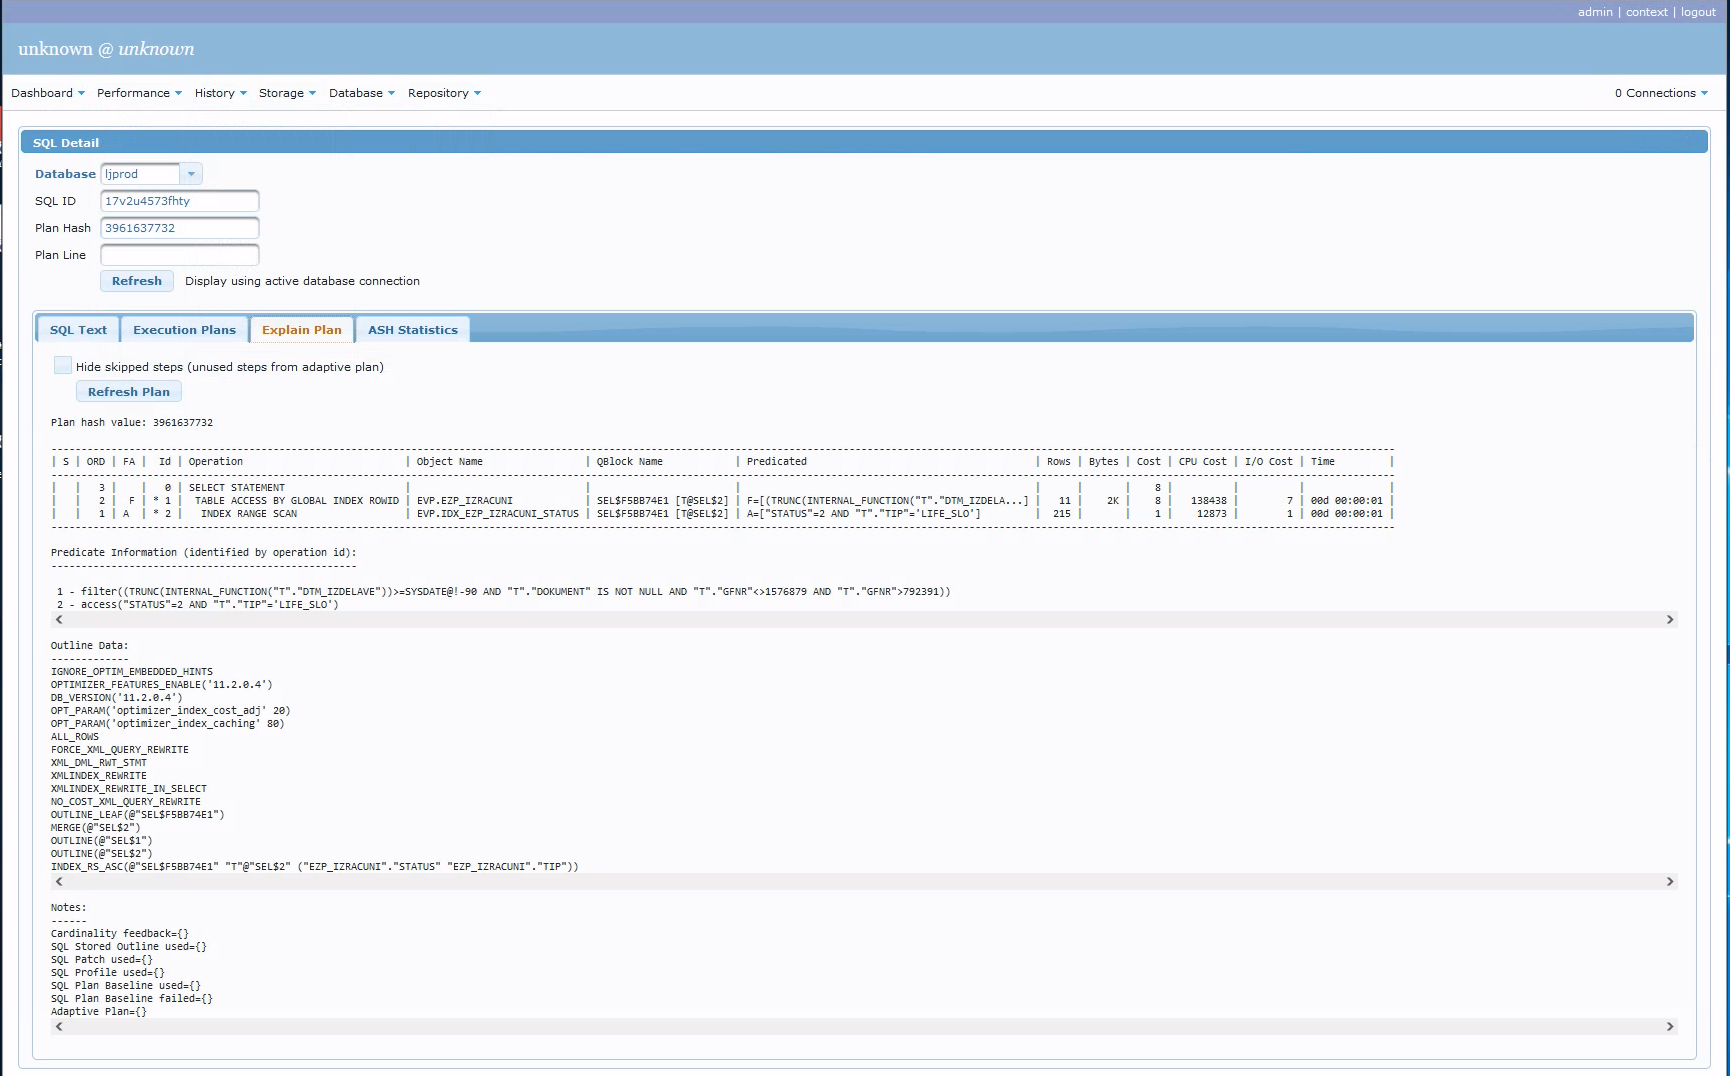 SQL execution plan
execution plan details
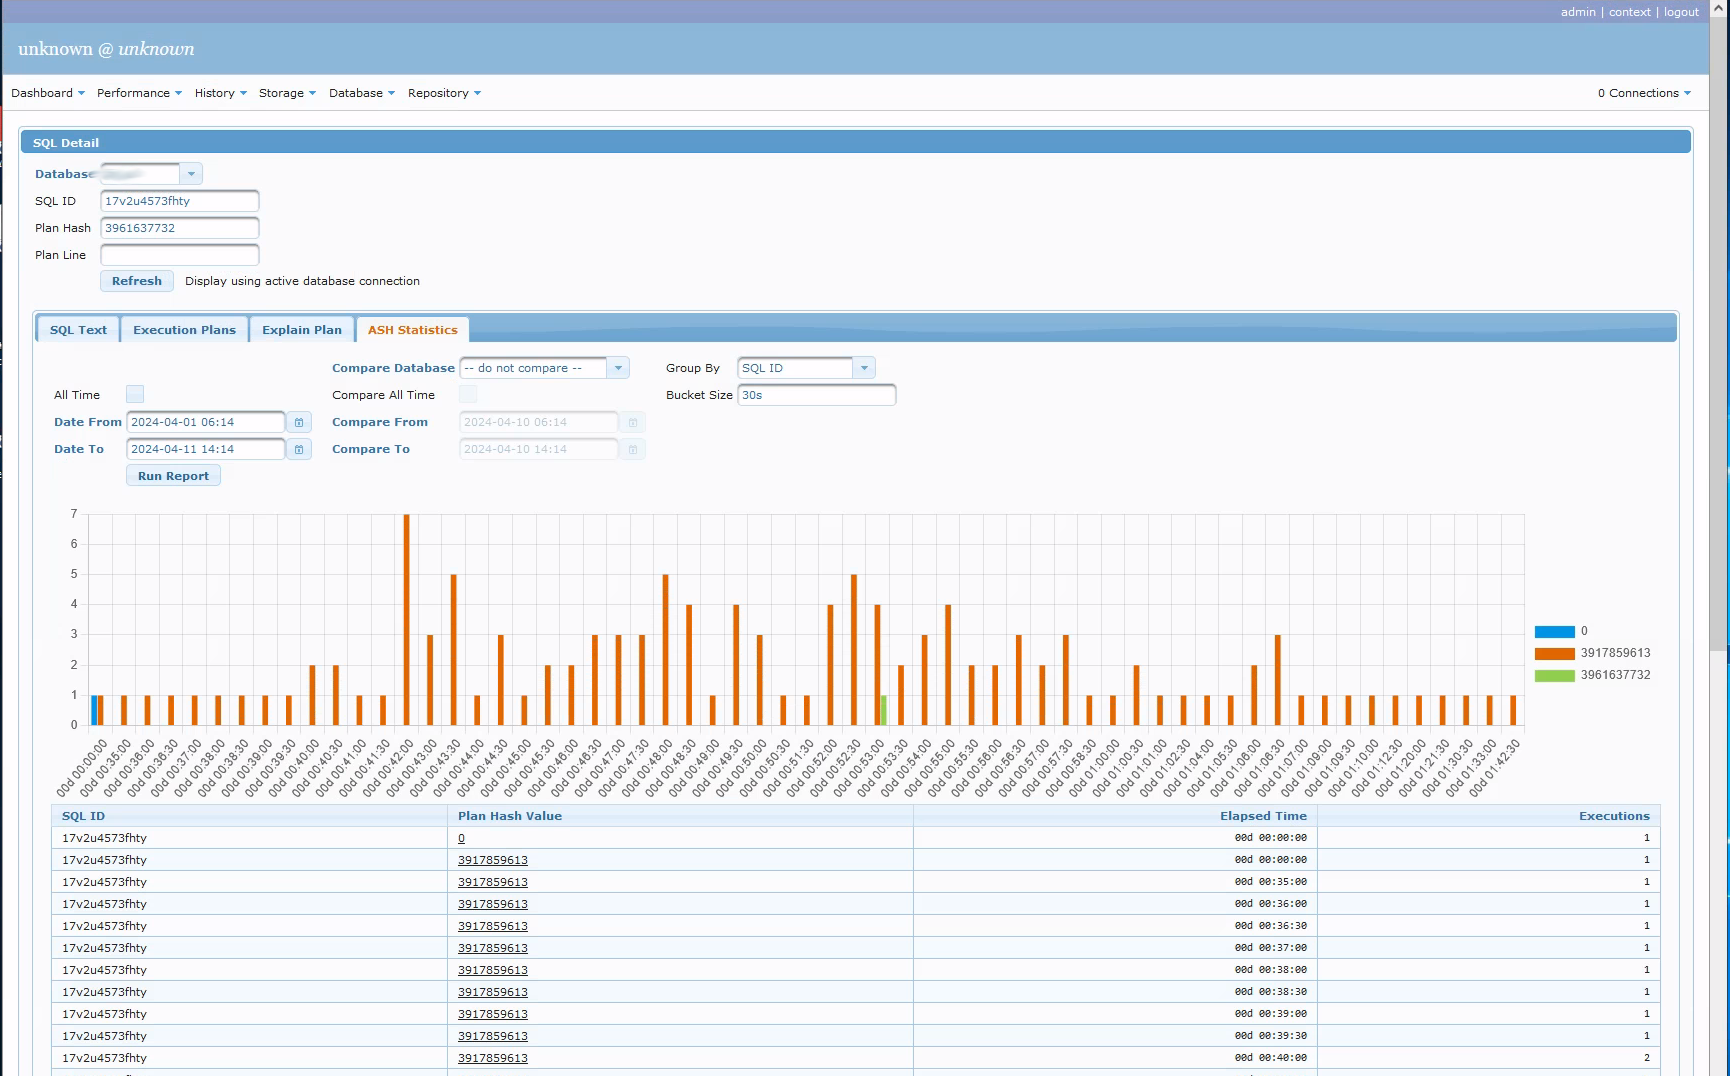 SQL ASH plan
Which execution plan performed best?
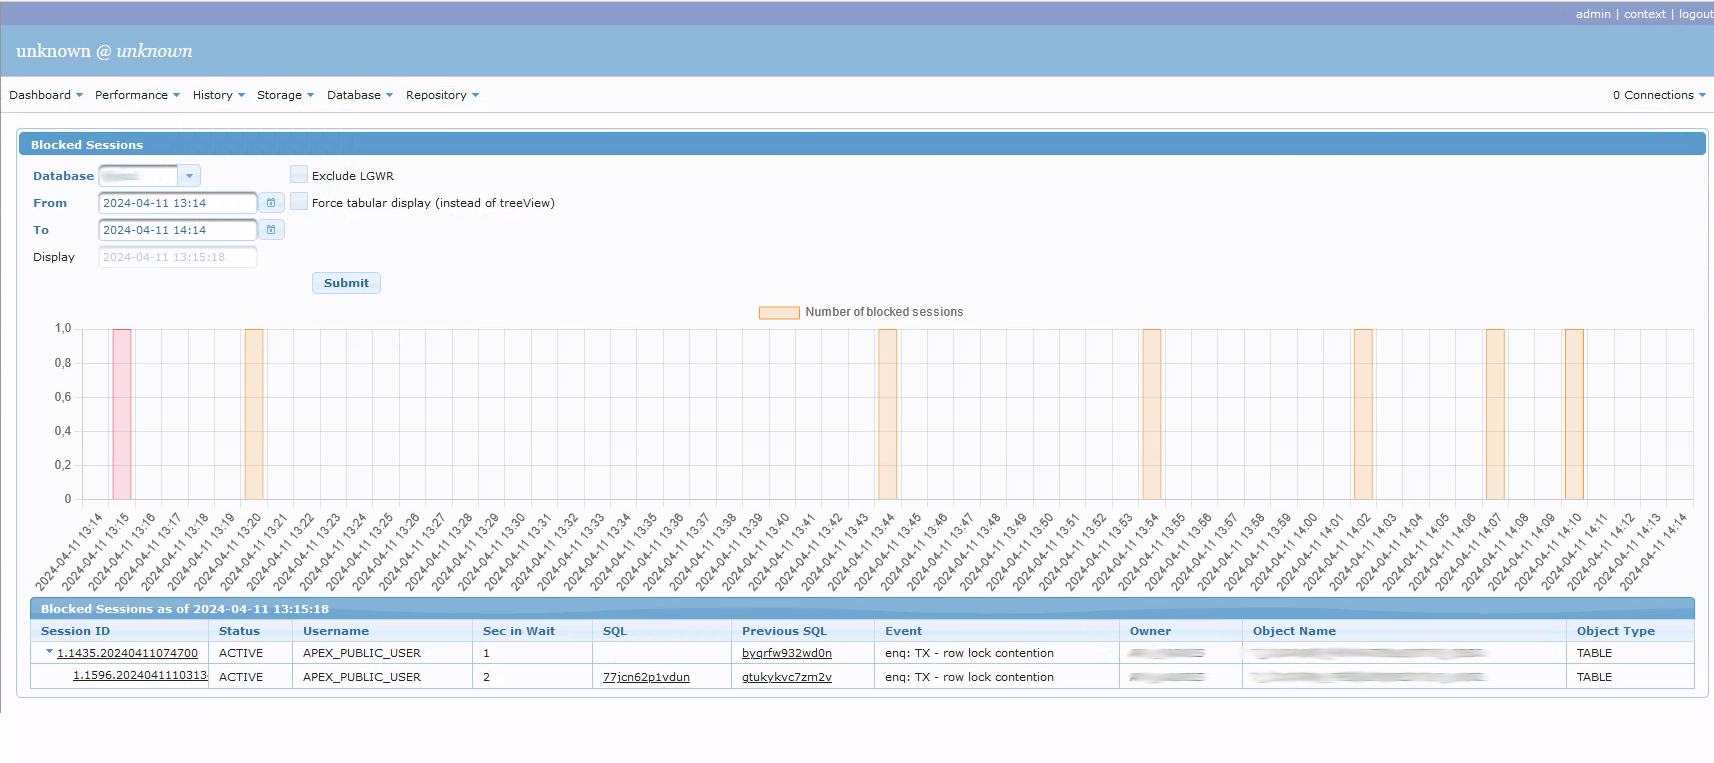 Blocked Sessions
How many and which sessions were blocked by who?
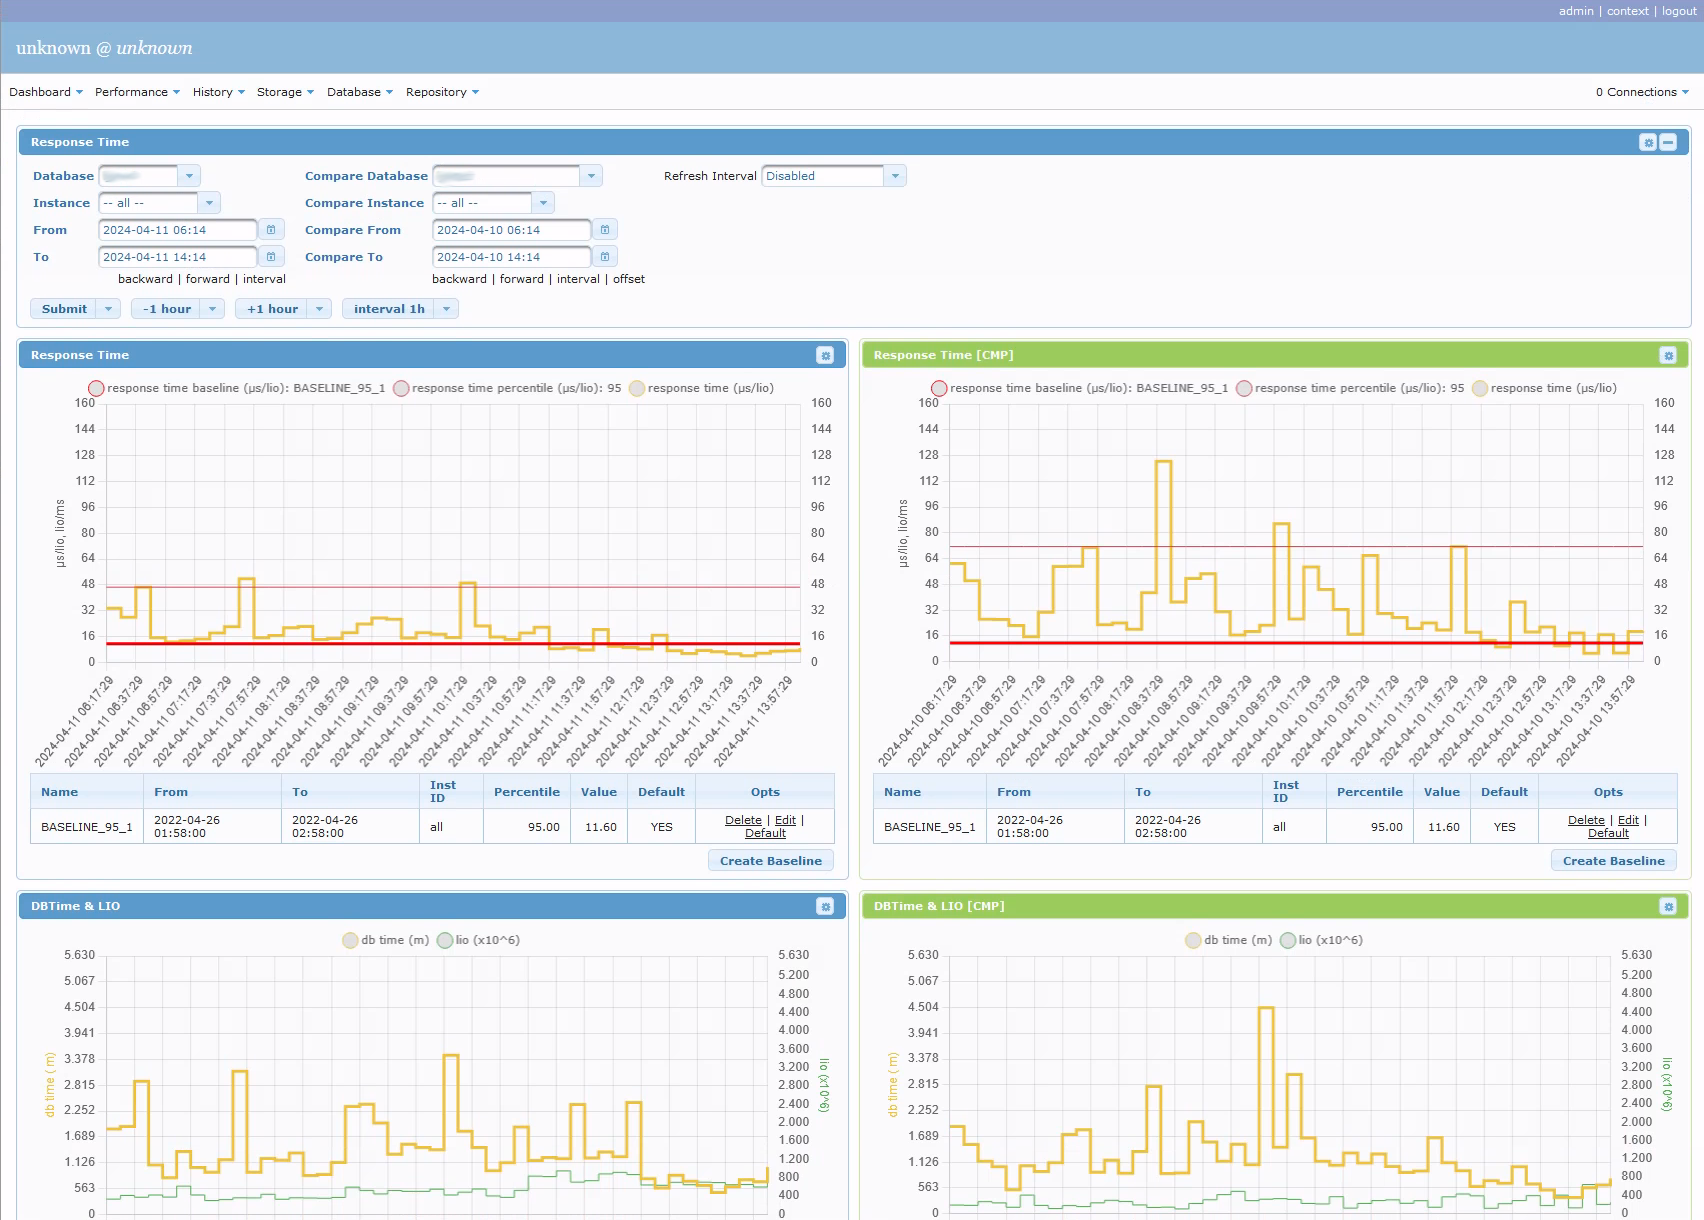 Response time compare
Comparing database response time for two periods/databases
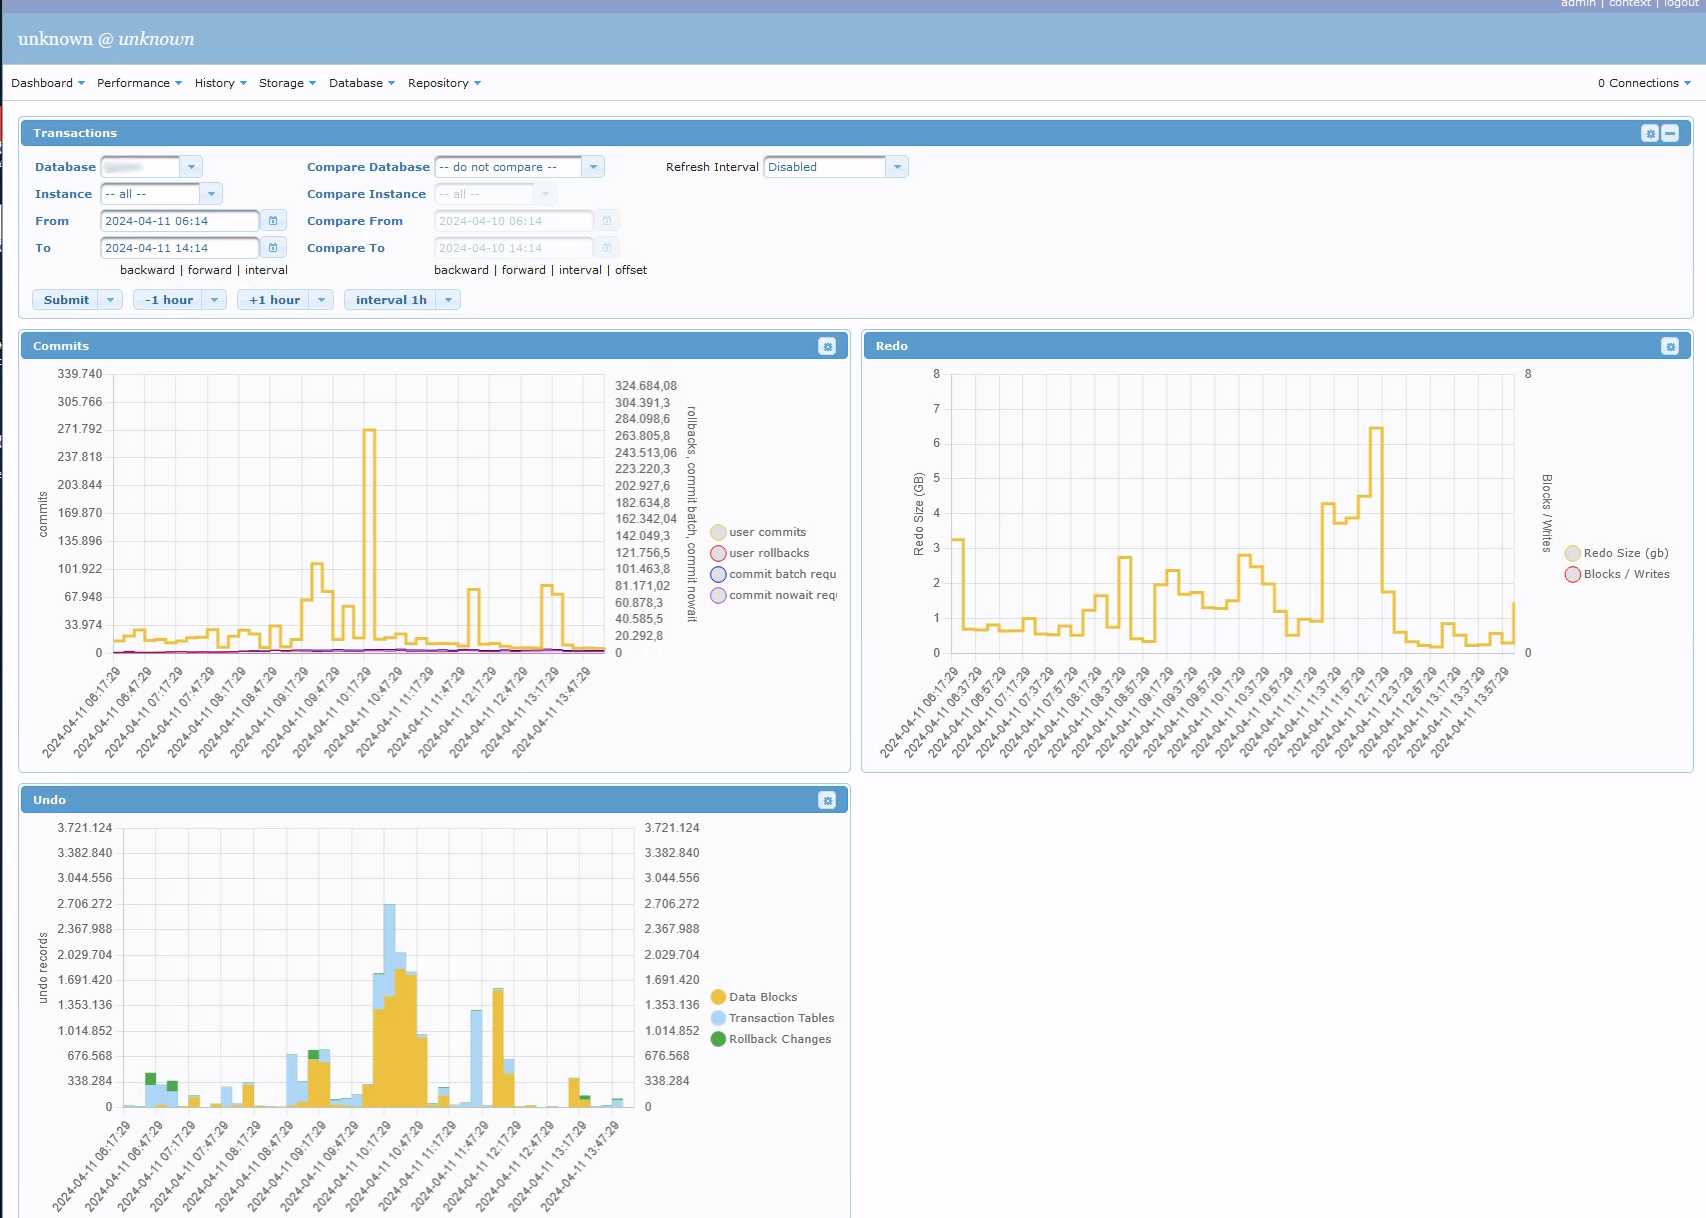 Transactions
Amount of redo, undo, commits, rollbacks, ...
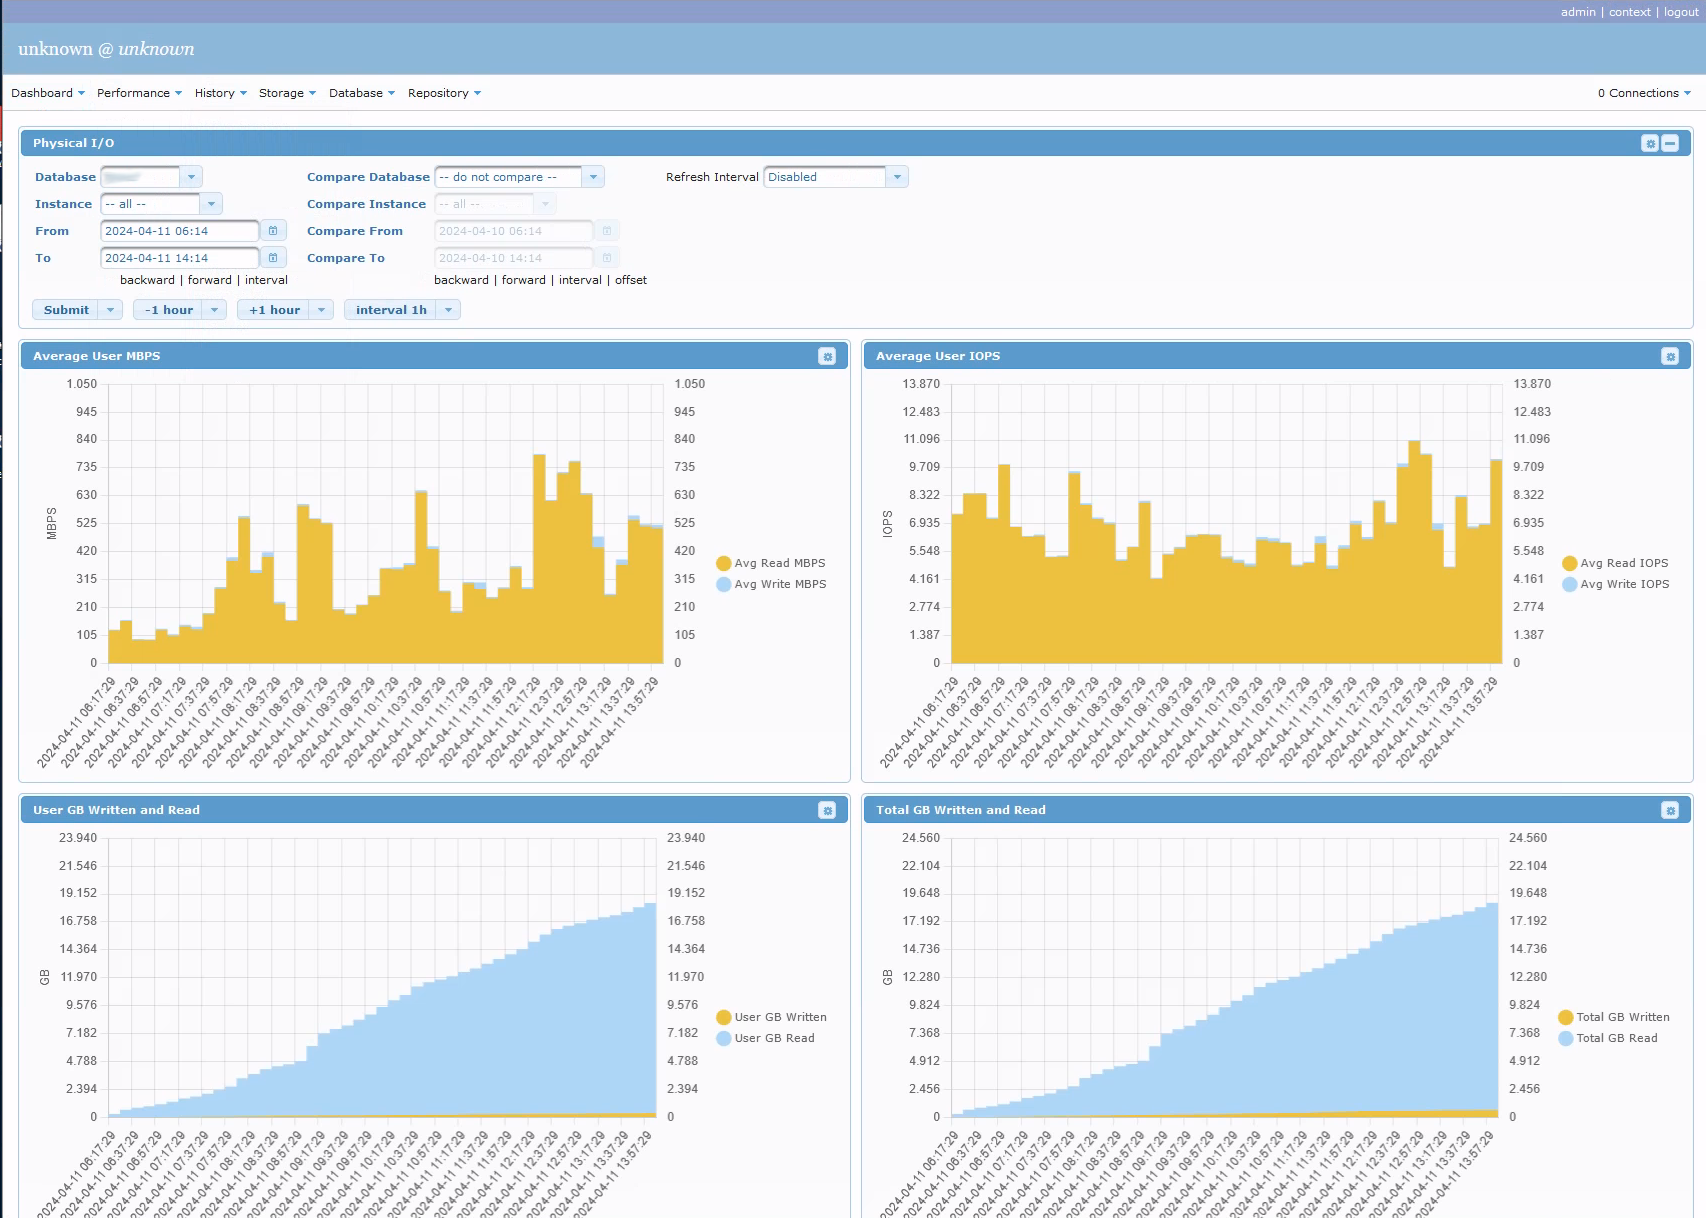 Physical I/O
Amount of MB/s, IOPS and Total GB written/read
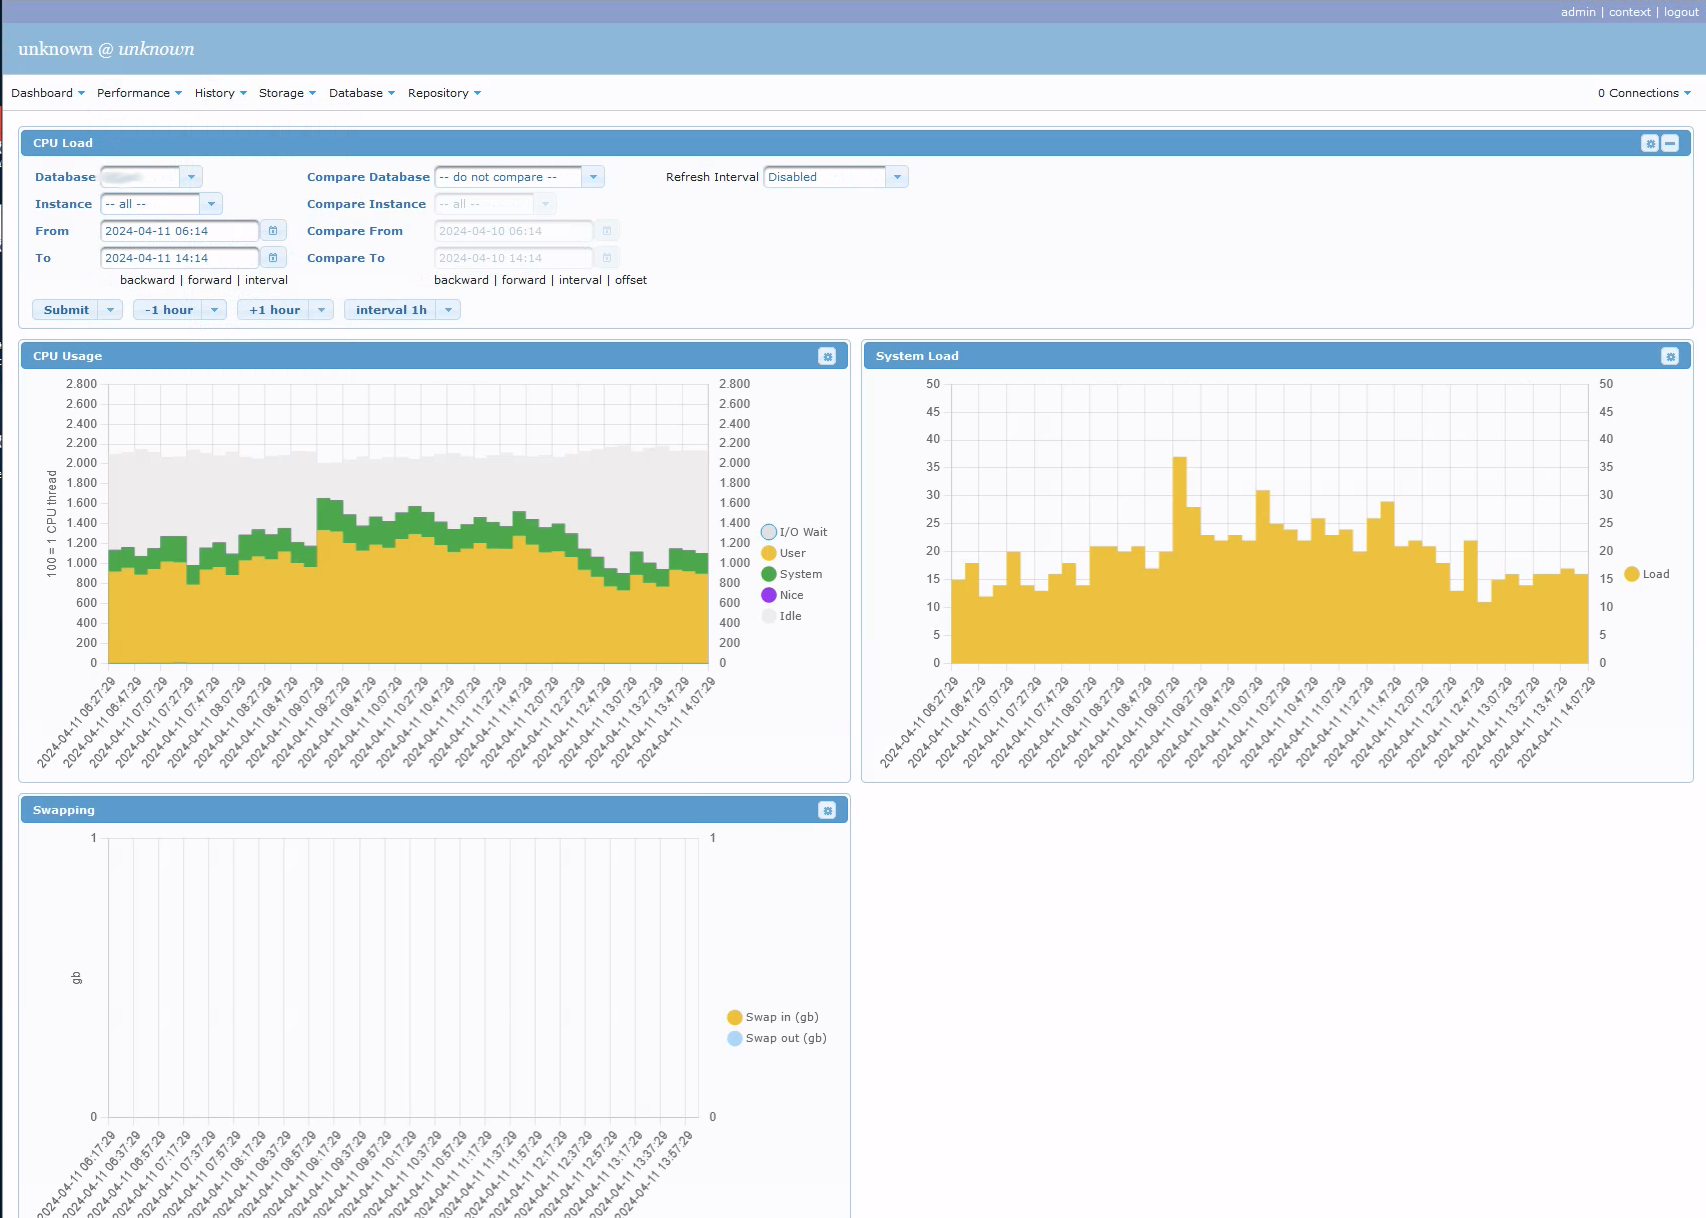 CPU Usage
CPU Usage (I/O, User, System) and swapping
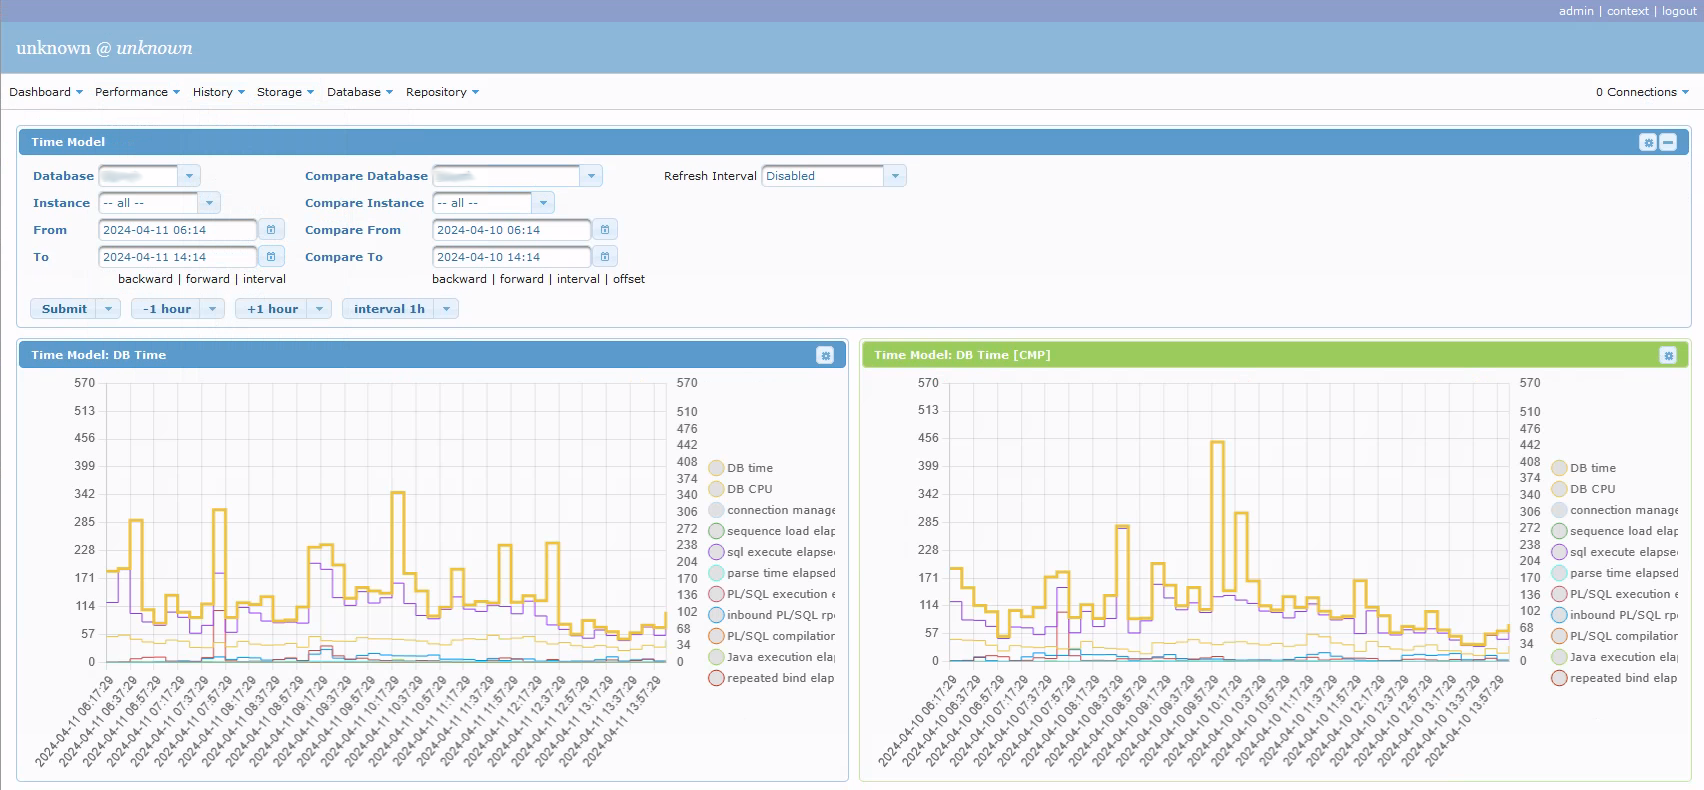 DB Time
Comparing DB Time between two periods
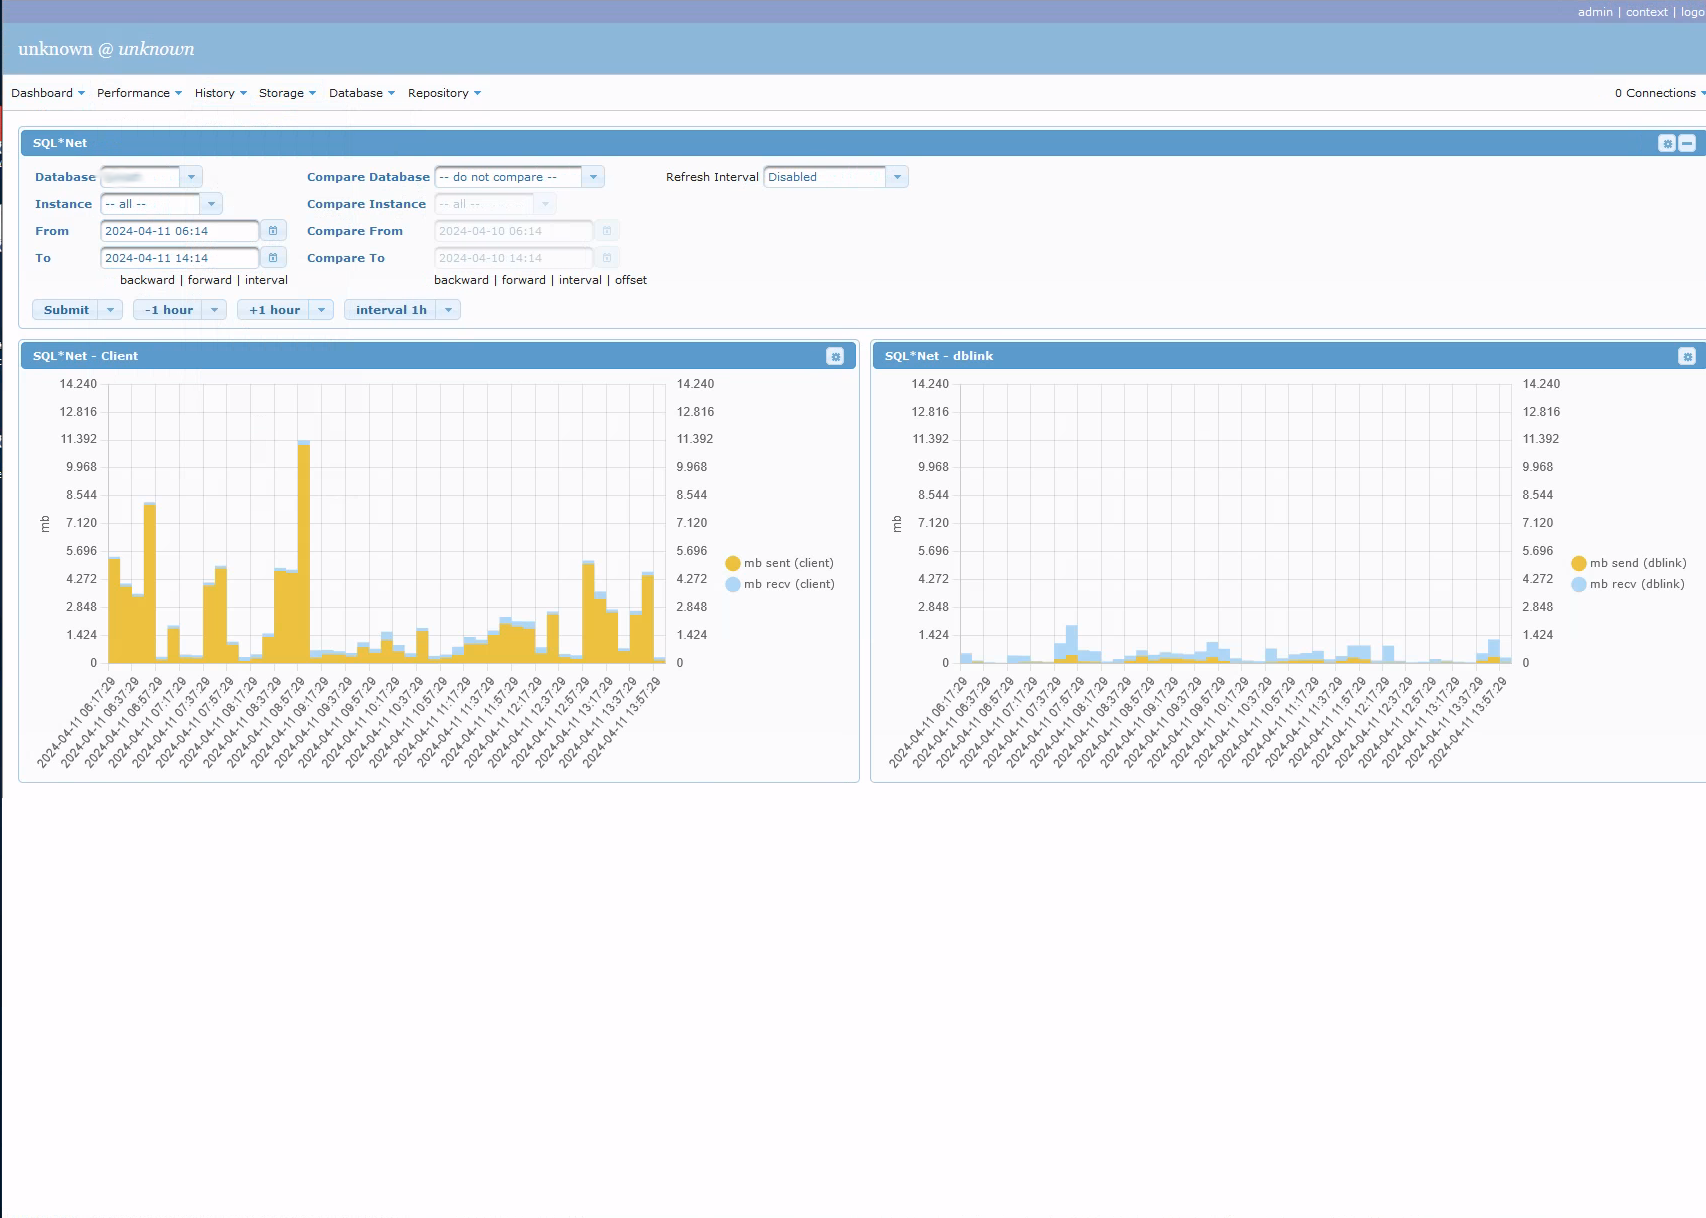 SQL*Net
Amount of MB sent/recieved by clients or db links