History -> Active Sessions
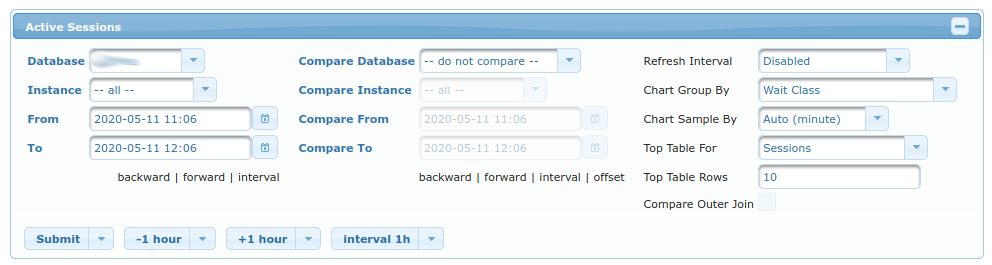
You must choose the database for which to display samples. This is done in the first column using fields:
Database- for which database to display the sampled dataInstance- for which instance to display sampled data (only relevant for RAC setups)FromandTo- for which period to display sampled data (it defaults to last hour)
In second column of fields, you can choose which database/period you want to compare the results of first column to:
Compare Database- which database to compare results toCompare Instance- which instance to compare results to (only relevant for RAC setups)Compare FromandCompare To- which period to compare to (it defaults to last hour)
In third column of fields, you can fine-tune what/how is displayed:
Refresh Interval- If enabled, the results are refreshed everynseconds (and timestamp forwarded).Chart Group By- Count amount of active sessions by this field (by default aWait Class, but it’s interesting to see other results such asusernameorinstance; all of them refer to columns fromv$session.Chart Sample By- Amount of average sessions are averaged by this field (by minute, hour, or day).Top Table For- What to display inTop Tabletable bellow. Among the most interesting fields (other thanSessionwhich is default) areSQL- which displays most resource-consuming SQL-sPLAN- which displays most resource-consuming Execution Plans.SQL (per execution)andPLAN (per execution)are different in that they display amount of resources consumed on average by single execution of SQL or it’s PLAN.
Top Table Rows- Amount of rows displayed inTop TableCompare Outer Join- Only relevant whenCompare Databaseis selected; It determines whether or not to display rows that are specific to either on or the other database (DatabaseandCompare Database).
Buttons are used to move through time more quickly - alternative would be to manually insert different dates into From and To fields.
Charts
ASH
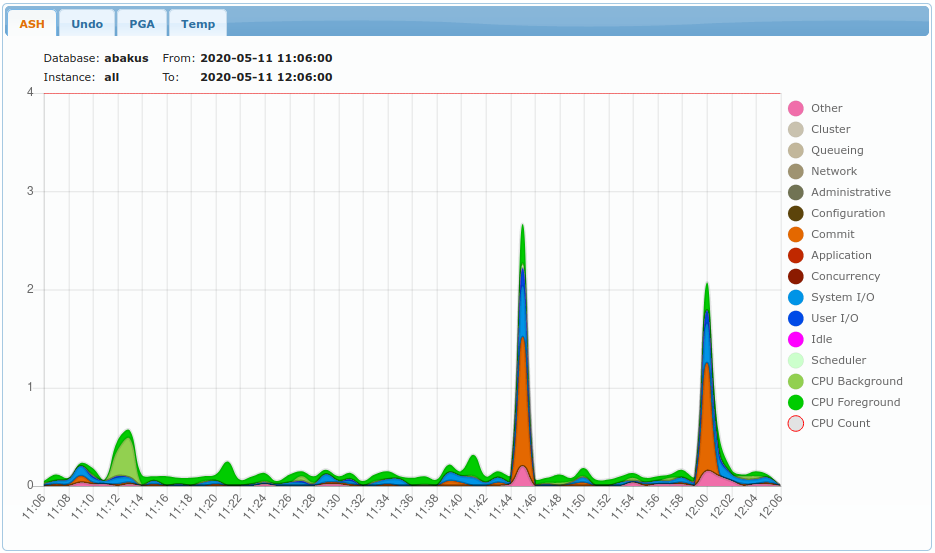
Legend displays what was selected in Chart Group By column.
On Y axis is the number of concurrently active sessions.
Data comes from samples of v$session view.
Undo
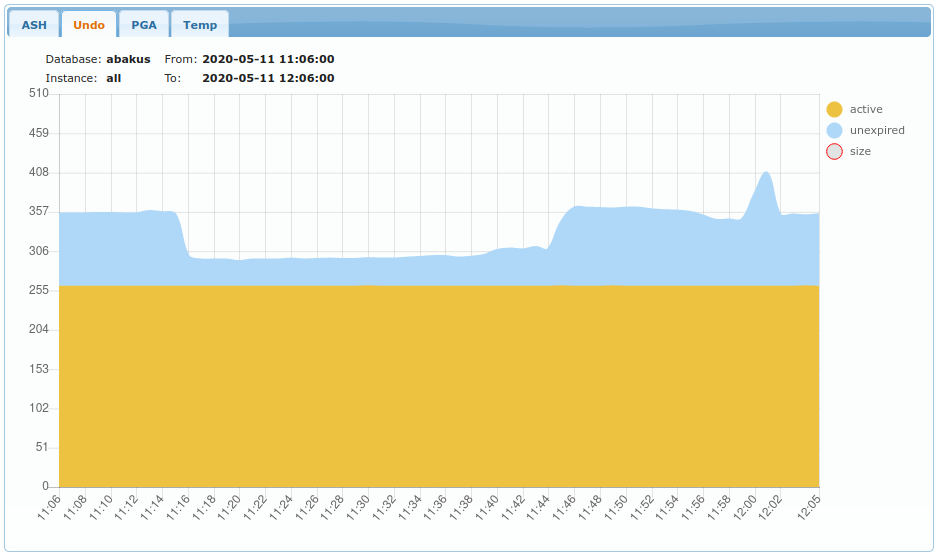
Displays amount of UNDO used in MB (megabytes). Data comes from samples of v$transaction.
PGA
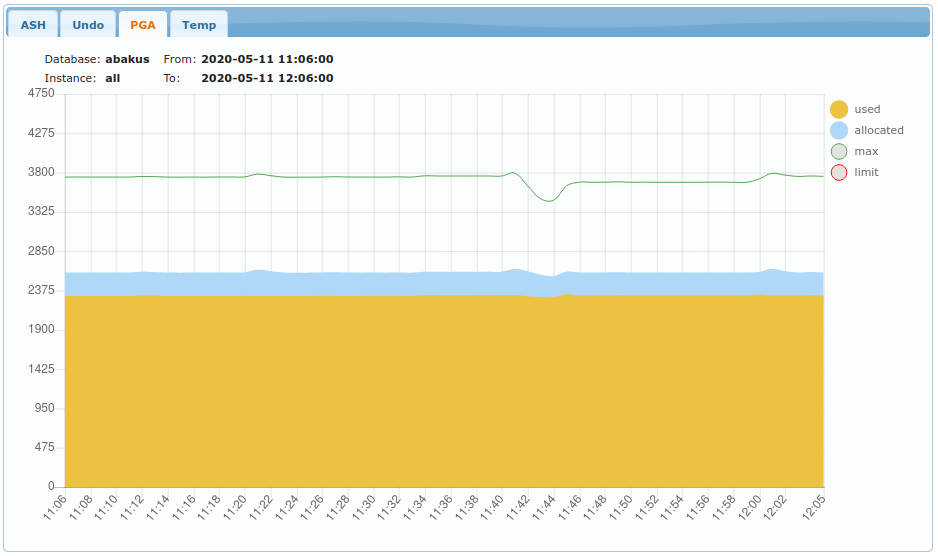
Displays amount of PGA used in MB (megabytes). Data comes from samples of v$process.
Temp
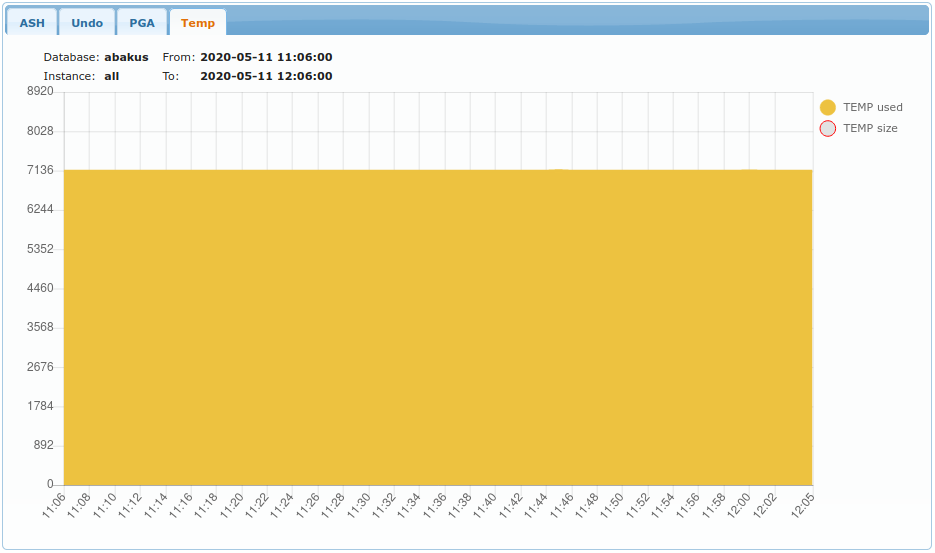
Displays amount of TEMP space usage (by temp tablespaces).
Top table
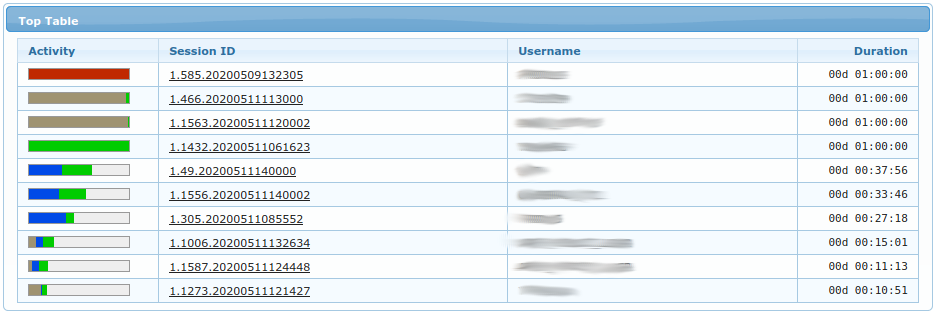
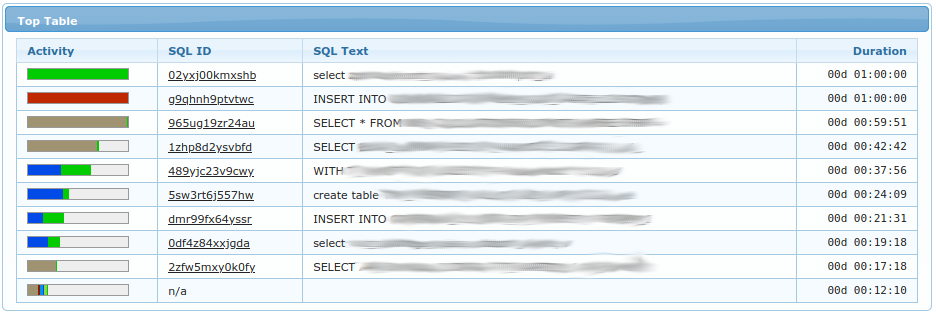
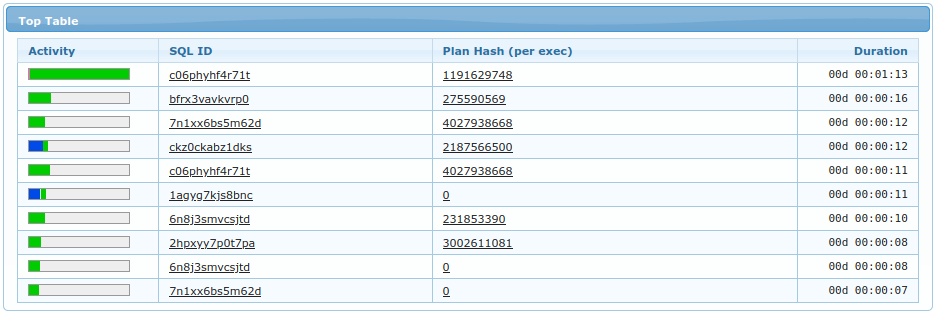
Top table displays what was selected in Top Table For field. Examples above are for Sessions, SQL and PLAN.
You can click on specific sql_id or specific plan_hash_value to see details of selected SQL or Plan.
Activity column displays how many times this object was seen in regard to the object displayed in first row.
Duration column displays amount of times (=seconds) such object was seen as ACTIVE in v$session.
Last
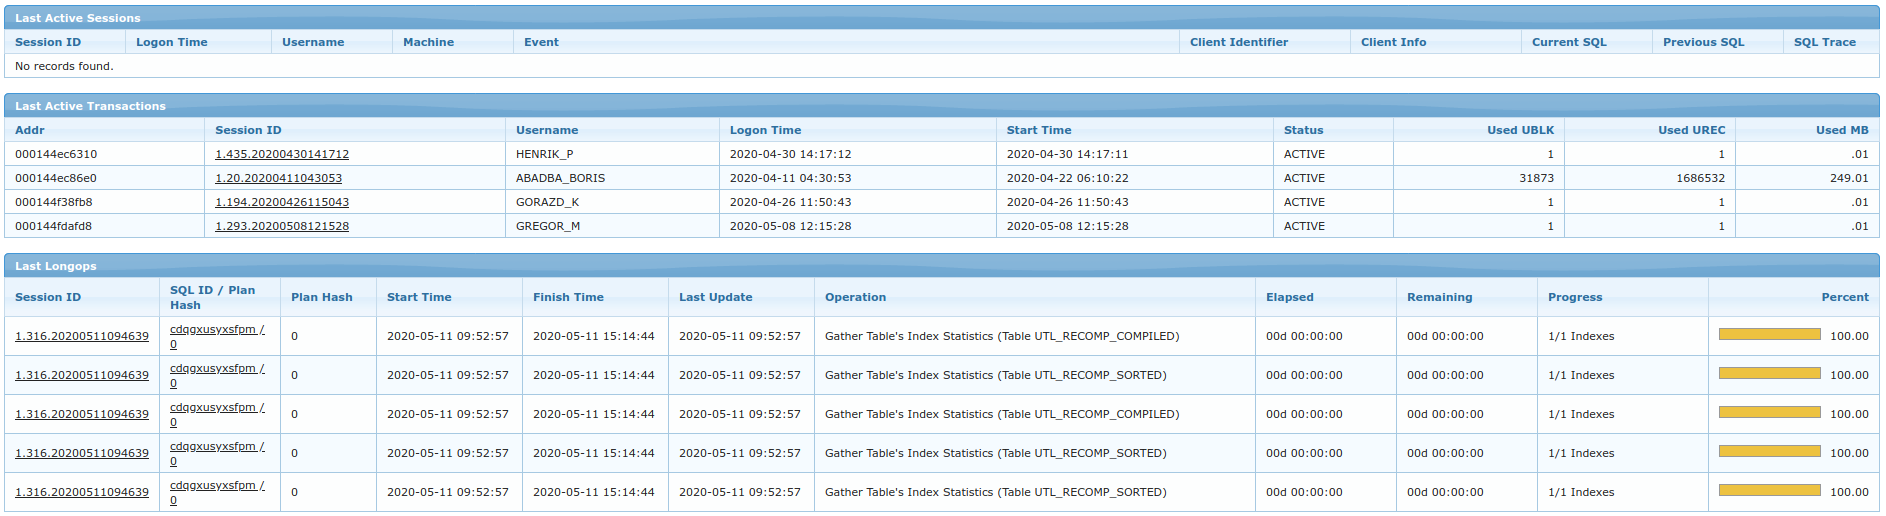
This section displays last non-aggregated samples which were collected at time less or equal to To field.
For definition of each column please refer to:
- Sessions
- Transactions
- Longops